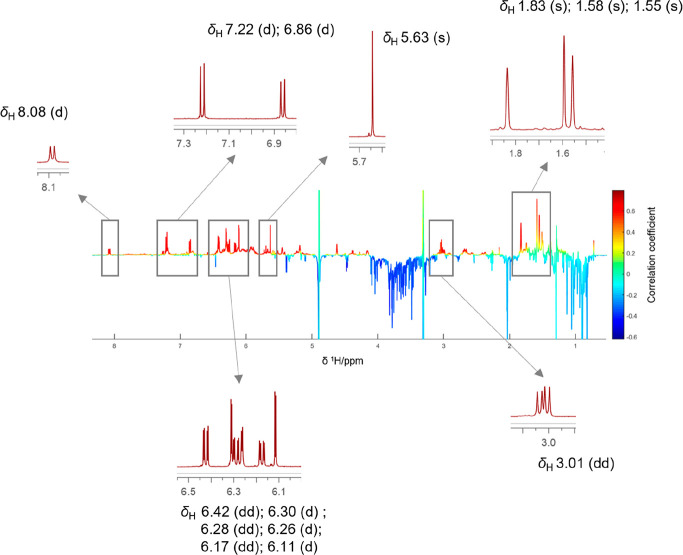
Figure 3.
1H NMR pseudospectrum showing the heterocovariance (HetCA) of 1H NMR spectra and influenza A virus inhibition data of 26 extracts produced by PLE. The color code is based on the correlation coefficient: blue = negatively correlated with activity; red = positively correlated with activity. Red signals are compared to expansions of the 1H NMR spectrum of compound 7.

