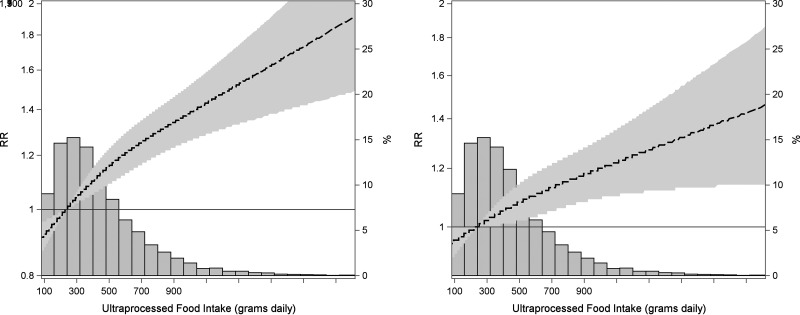
Figure 1.
Association of UPF consumption with the incidence of MetS, as estimated through Poisson regression with robust variance using restricted cubic splines and adjusting for age, sex, center, race or color, income, school achievement, smoking, physical activity, alcohol, energy intake (model 4; left), and additionally for BMI (model 5; right). The dashed line shows the point RR estimates along the spectrum of UPF consumption, and the stippled area indicates the 95% confidence zone. The accompanying histogram shows the distribution of UPF consumption (percentage of study sample; right vertical axis).

