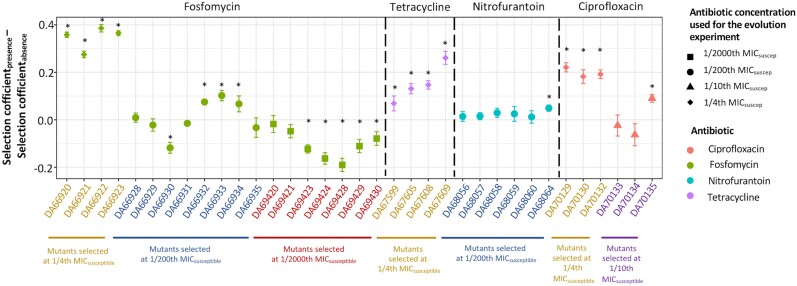
Fig. 6.
Determining the contribution of increased resistance to the increase in fitness. The contribution of increased resistance to an increase in fitness was determined by plotting the difference between the selection coefficients calculated from competition experiments between the resistant mutants and susceptible strains in the presence and absence of the antibiotic. A value higher than 0 denotes a measurable contribution of increased resistance to the increase in fitness. Values significantly different from 0 are marked with a * in the figure. The error bars represent standard deviations calculated based on standard deviations from individual means. Different shapes represent the antibiotic concentrations where selection for specific resistant mutants was observed and different colors represent different antibiotics. Two-tailed Student’s t-test was performed to test for statistically significant differences at P = 0.05.

