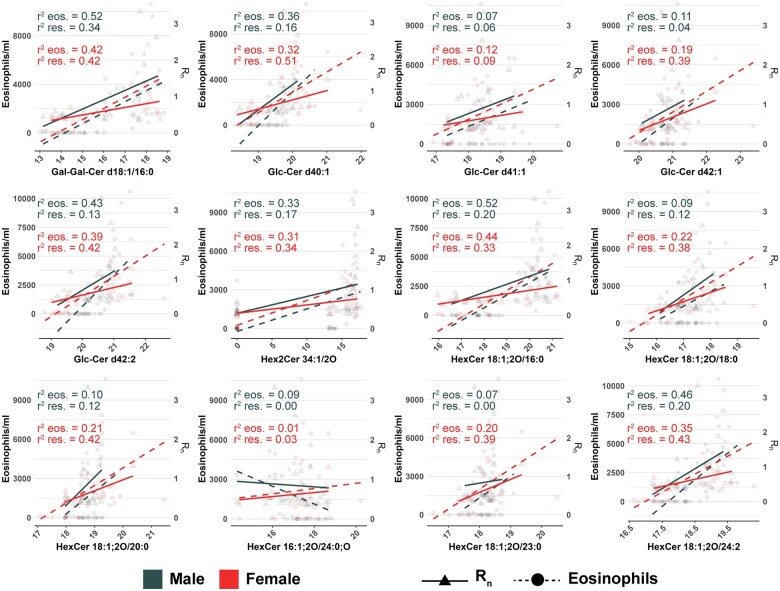
Figure 6.
Eosinophilia and airway resistance are positively associated with glycosphingolipid abundance. Regression analysis between individual glycosphingolipid species and either BALF eosinophil counts, or Rn values obtained from pulmonary function testing. Solid lines and dotted lines correspond to the regression lines for resistance values (triangles) and eosinophil counts (circles), respectively. The coefficient of determination (R2) is included for both male and female mice, and statistically significant relationships are included in Supplementary Table 7. Values were based on results of a simple linear regression model, and significant associations were based on p < .05.

