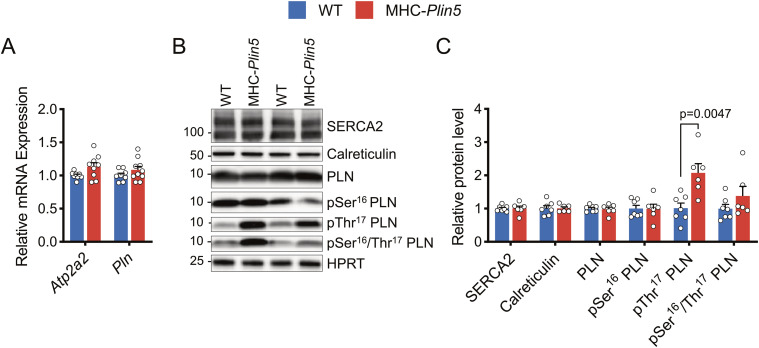
Figure 5. Plin5 overexpression likely contributes to modulations of SERCA2 interaction capacity and/or modulation of regulatory partners.
(A) mRNA expression of the indicated genes in isolated primary cardiomyocytes from WT and MHC-Plin5 mice (nmice = 8 [WT], 9–10 [MHC-Plin5] from ≥3 independent isolations). (B) Representative immunoblot images of SERCA2, calreticulin, and PLN (pSer16, pThr17, pSer16/Thr17, and total) in isolated primary cardiomyocytes from WT and MHC-Plin5 mice. HPRT served as a loading control. (C) Quantification of (B) (nmice = 7 [WT], 6 [MHC-Plin5] from ≥2 independent isolations). Values are the mean ± SEM; P-values are calculated by a t test.
Source data are available for this figure.

