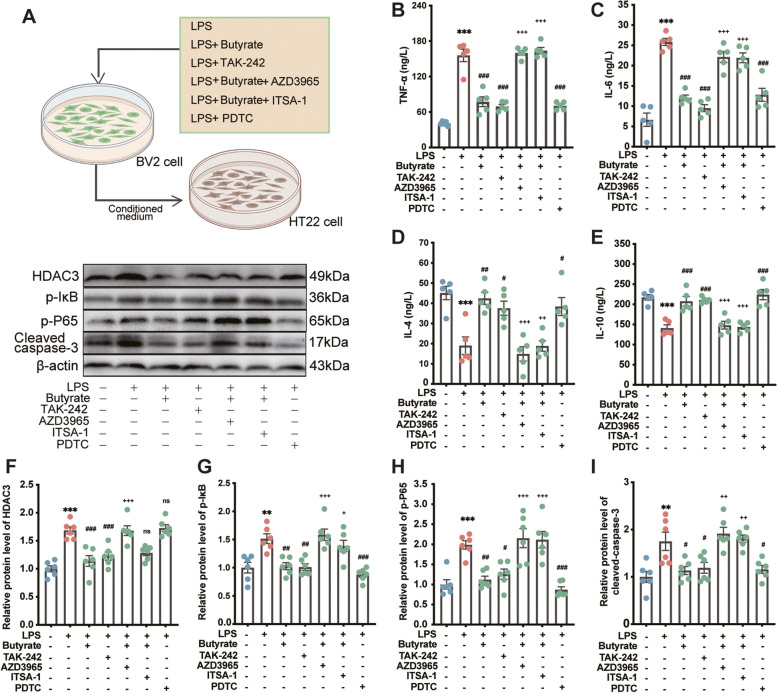
Fig. 10.
Effect of butyrate on inflammatory response and cell neurotoxicity in BV2 cells induced by LPS. A Schematic illustration of experimental design. B–E The levels of cytokines (TNF-α, IL-6, IL-4, and IL-10) in the BV2 cells (n = 5). F–H Relative protein levels of HDAC3, p-IκB and p-P65 in the BV2 cells (n = 6). I Relative protein levels of cleaved caspase-3 in the HT22 cells (n = 6). TAK-242: TLR4 inhibitor, PDTC:NF-κB antagonists, AZD3965:MCT1 inhibitor, ITSA-1: HDAC3 agonist. The data represent the mean ± SEM, p < 0.05 was set as the threshold for significance by one-way ANOVA followed by post hoc comparisons using Tukey’s test for multiple groups’ comparisons. *p < 0.05, **p < 0.01, ***p < 0.001 compared to the control group. # p < 0.05, ## p < 0.01, ### p < 0.001 compared to LPS group. + p < 0.05, + + p < 0.01, + + + p < 0.001 compared to LPS + Mel group

