Fig. 10.
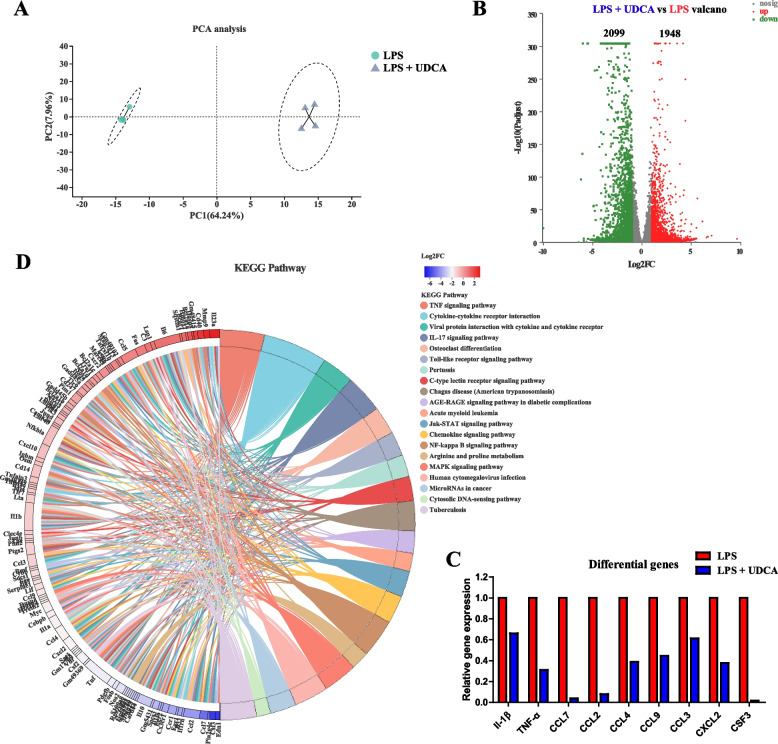
Transcriptional profiling of LPS-treated J774A.1 cells in the presence or absence of UDCA (n = 4). A PCA plot of the transcriptional profiles between the two groups. B Volcano plot of significantly differentially expressed genes between the two groups. The differentially expressed genes included only those showing a > 2-fold difference and FDR < 0.05. C Inhibition of a panel of LPS-induced proinflammatory cytokine and chemokine gene expression in the presence of UDCA. D Differential enrichment of KEGG pathways in LPS-stimulated cells following UDCA treatment

