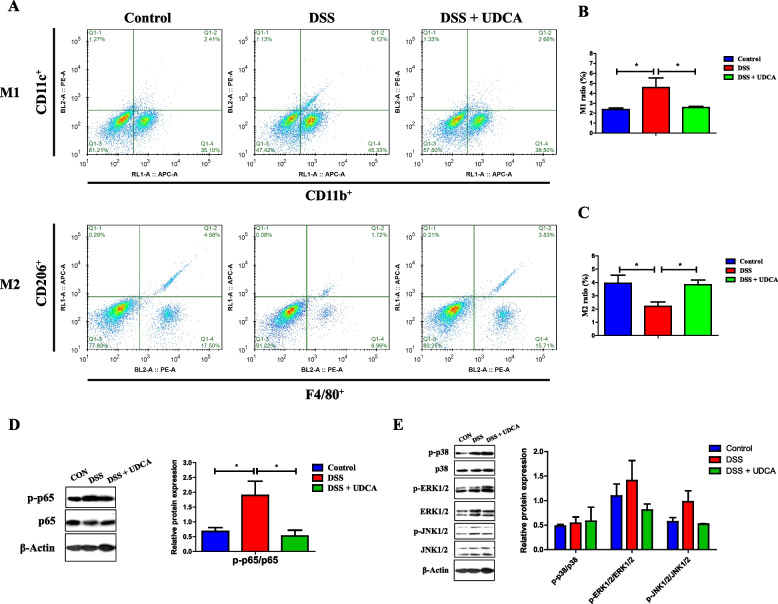
Fig. 9.
Effect of UDCA on macrophage polarization and NF-κB inhibition in DSS-treated mice (n = 8). Shown are representative flow cytometry plots (A) as well as the prevalence of M1 macrophages (CD11b+CD11c+) (B) and M2 macrophages (F4/80+CD206+) (C) in the colonic homogenate of DSS-treated mice in response to UDCA. D Decreased phosphorylation of p65 NF-κB in the colon of DSS-treated mice in response to UDCA. E Phosphorylation of p38, ERK1/2, and JNK1/2 in the colon of DSS-treated mice in response to UDCA. Data are presented as means ± SEM. *P < 0.05

