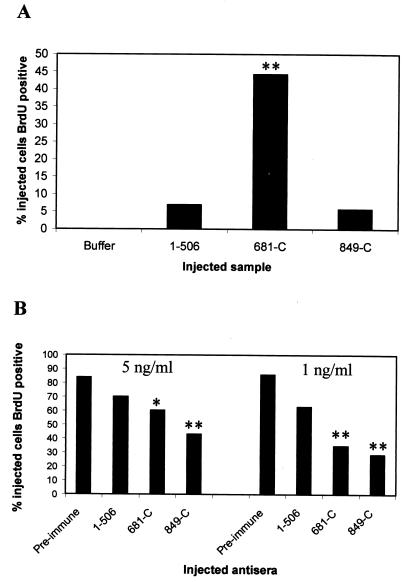
FIG. 4.
(A) Graph showing the percentage of cells microinjected with GST fusion proteins that were BrdU positive. The results show the totals from three separate experiments. At least 40 cells were injected with each protein. Results for the fragments were compared to results for buffer alone by using the chi-square test (✽✽, P < 0.001). (B) Inhibition of DNA synthesis induced by PMT in Swiss 3T3 cells microinjected with different antisera. Cells were incubated in the presence of 5 or 1 ng of PMT/ml as shown. The x axis shows the four antisera used. Results for the PMT antibodies were compared to those with preimmune serum by using the chi-square test (✽, P < 0.01; ✽✽, P < 0.001).

