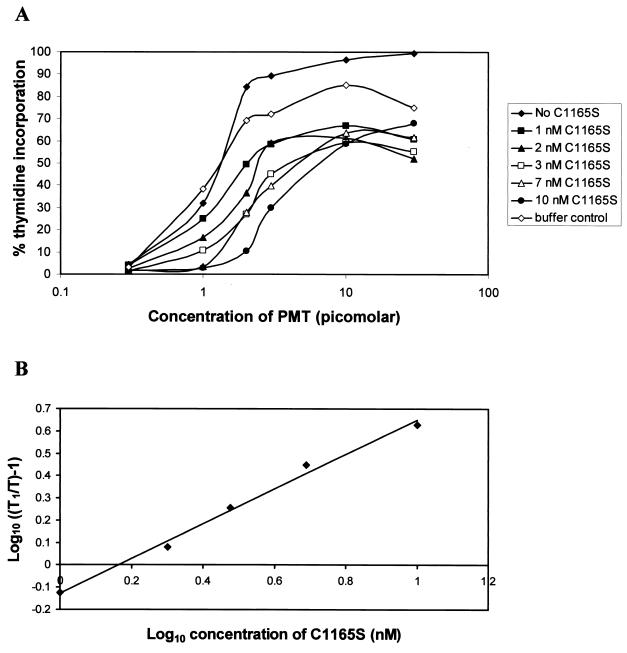
FIG. 5.
Schild plot analysis for the determination of the affinity of PMT for its cell surface receptor. (A) Competition curves showing the inhibition of PMT activity by the addition of several fixed concentrations of C1165S. The results are expressed as the percentage of tritiated thymidine incorporation induced by 10% fetal calf serum. The buffer control curve was obtained by using the same volume of toxin storage buffer (0.2 M NaCl; 25 mM Tris, pH 6.5; 50% [vol/vol] glycerol) as was present for the highest concentration of C1165S (10 nM). (B) Data were plotted according to the method of Schild (41). T, concentration of PMT to obtain 45% of the thymidine incorporation induced by 10% fetal calf serum; T1, concentration of PMT after addition of a given amount of C1165S which gave the same activity. The dissociation constant, Kd, for the toxin was calculated from the point at which the line intersects the x axis to be ca. 1.5 nM.

