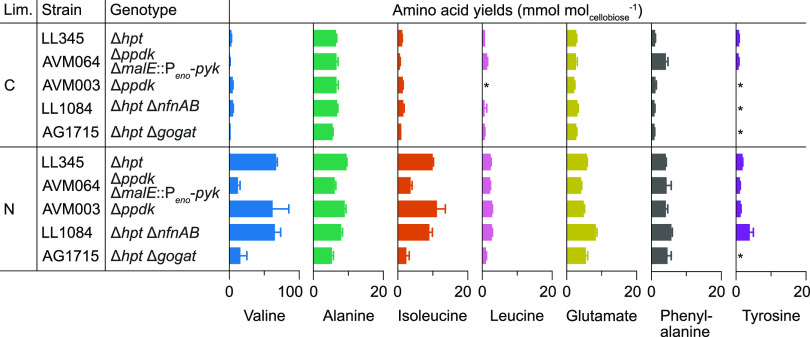
FIG 2.
Amino acid yields in chemostats with either cellobiose (C) or ammonium (N) as the sole limiting nutrient at a dilution rate of 0.10 h−1. The remaining amino acids can be found in Table S6 and were either below the detection limit (*, <0.5 mmol molcellobiose−1) or only showed small changes. The error bars represent the standard deviation of three biological replicates.

