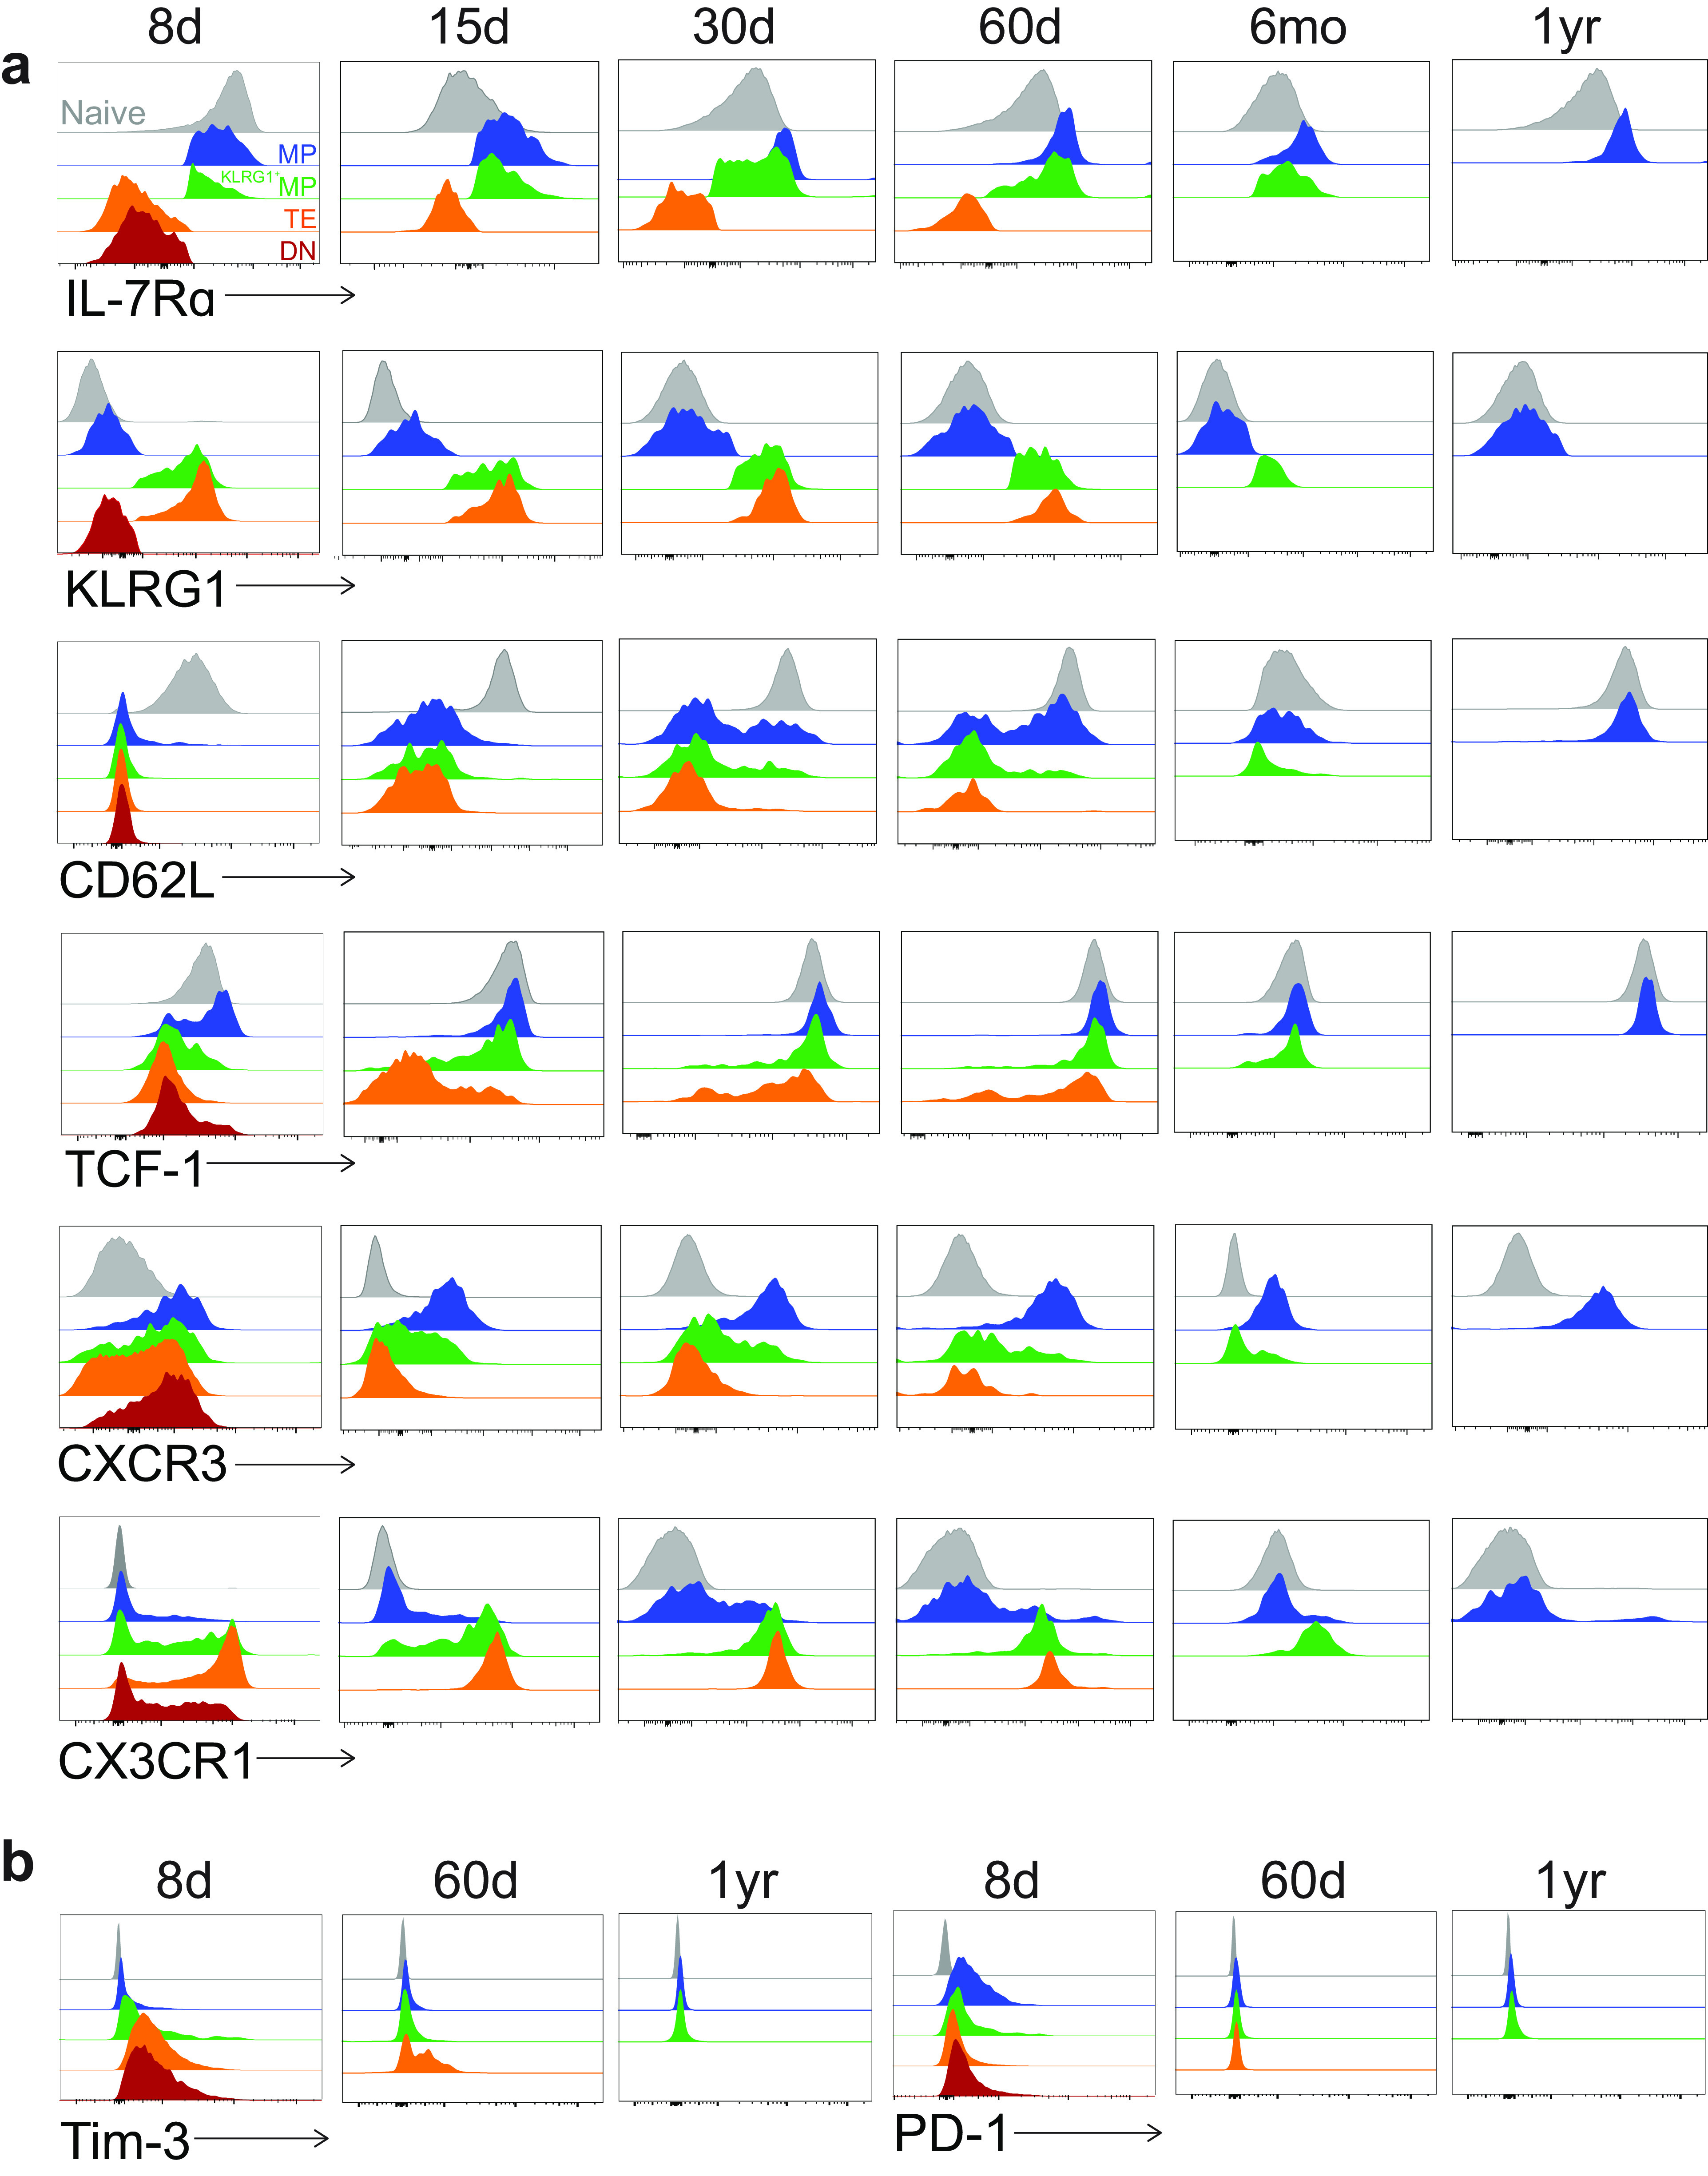
FIG 2.

Phenotypic profile of KLRG1/IL-7Rα subsets among GP33+ CD8 T cells after acute infection. (a) Flow cytometry staining of memory markers within each of the four indicated subsets from 8 days to 1 year postinfection. All subsets are gated on GP33+ CD8 T cells. Naive CD44lo CD8 T cells are shown as gray histograms at the top of each plot. The DN subset quickly diminished after infection and so is not shown after day 8; the TE and KLRG1+ MP subsets also diminished after day 60 and so are not shown after that time point. (b) Flow cytometry staining of exhaustion markers within each of the four indicated subsets as in a. Representative flow plots are shown; n = 3 to 12 mice per time point.
