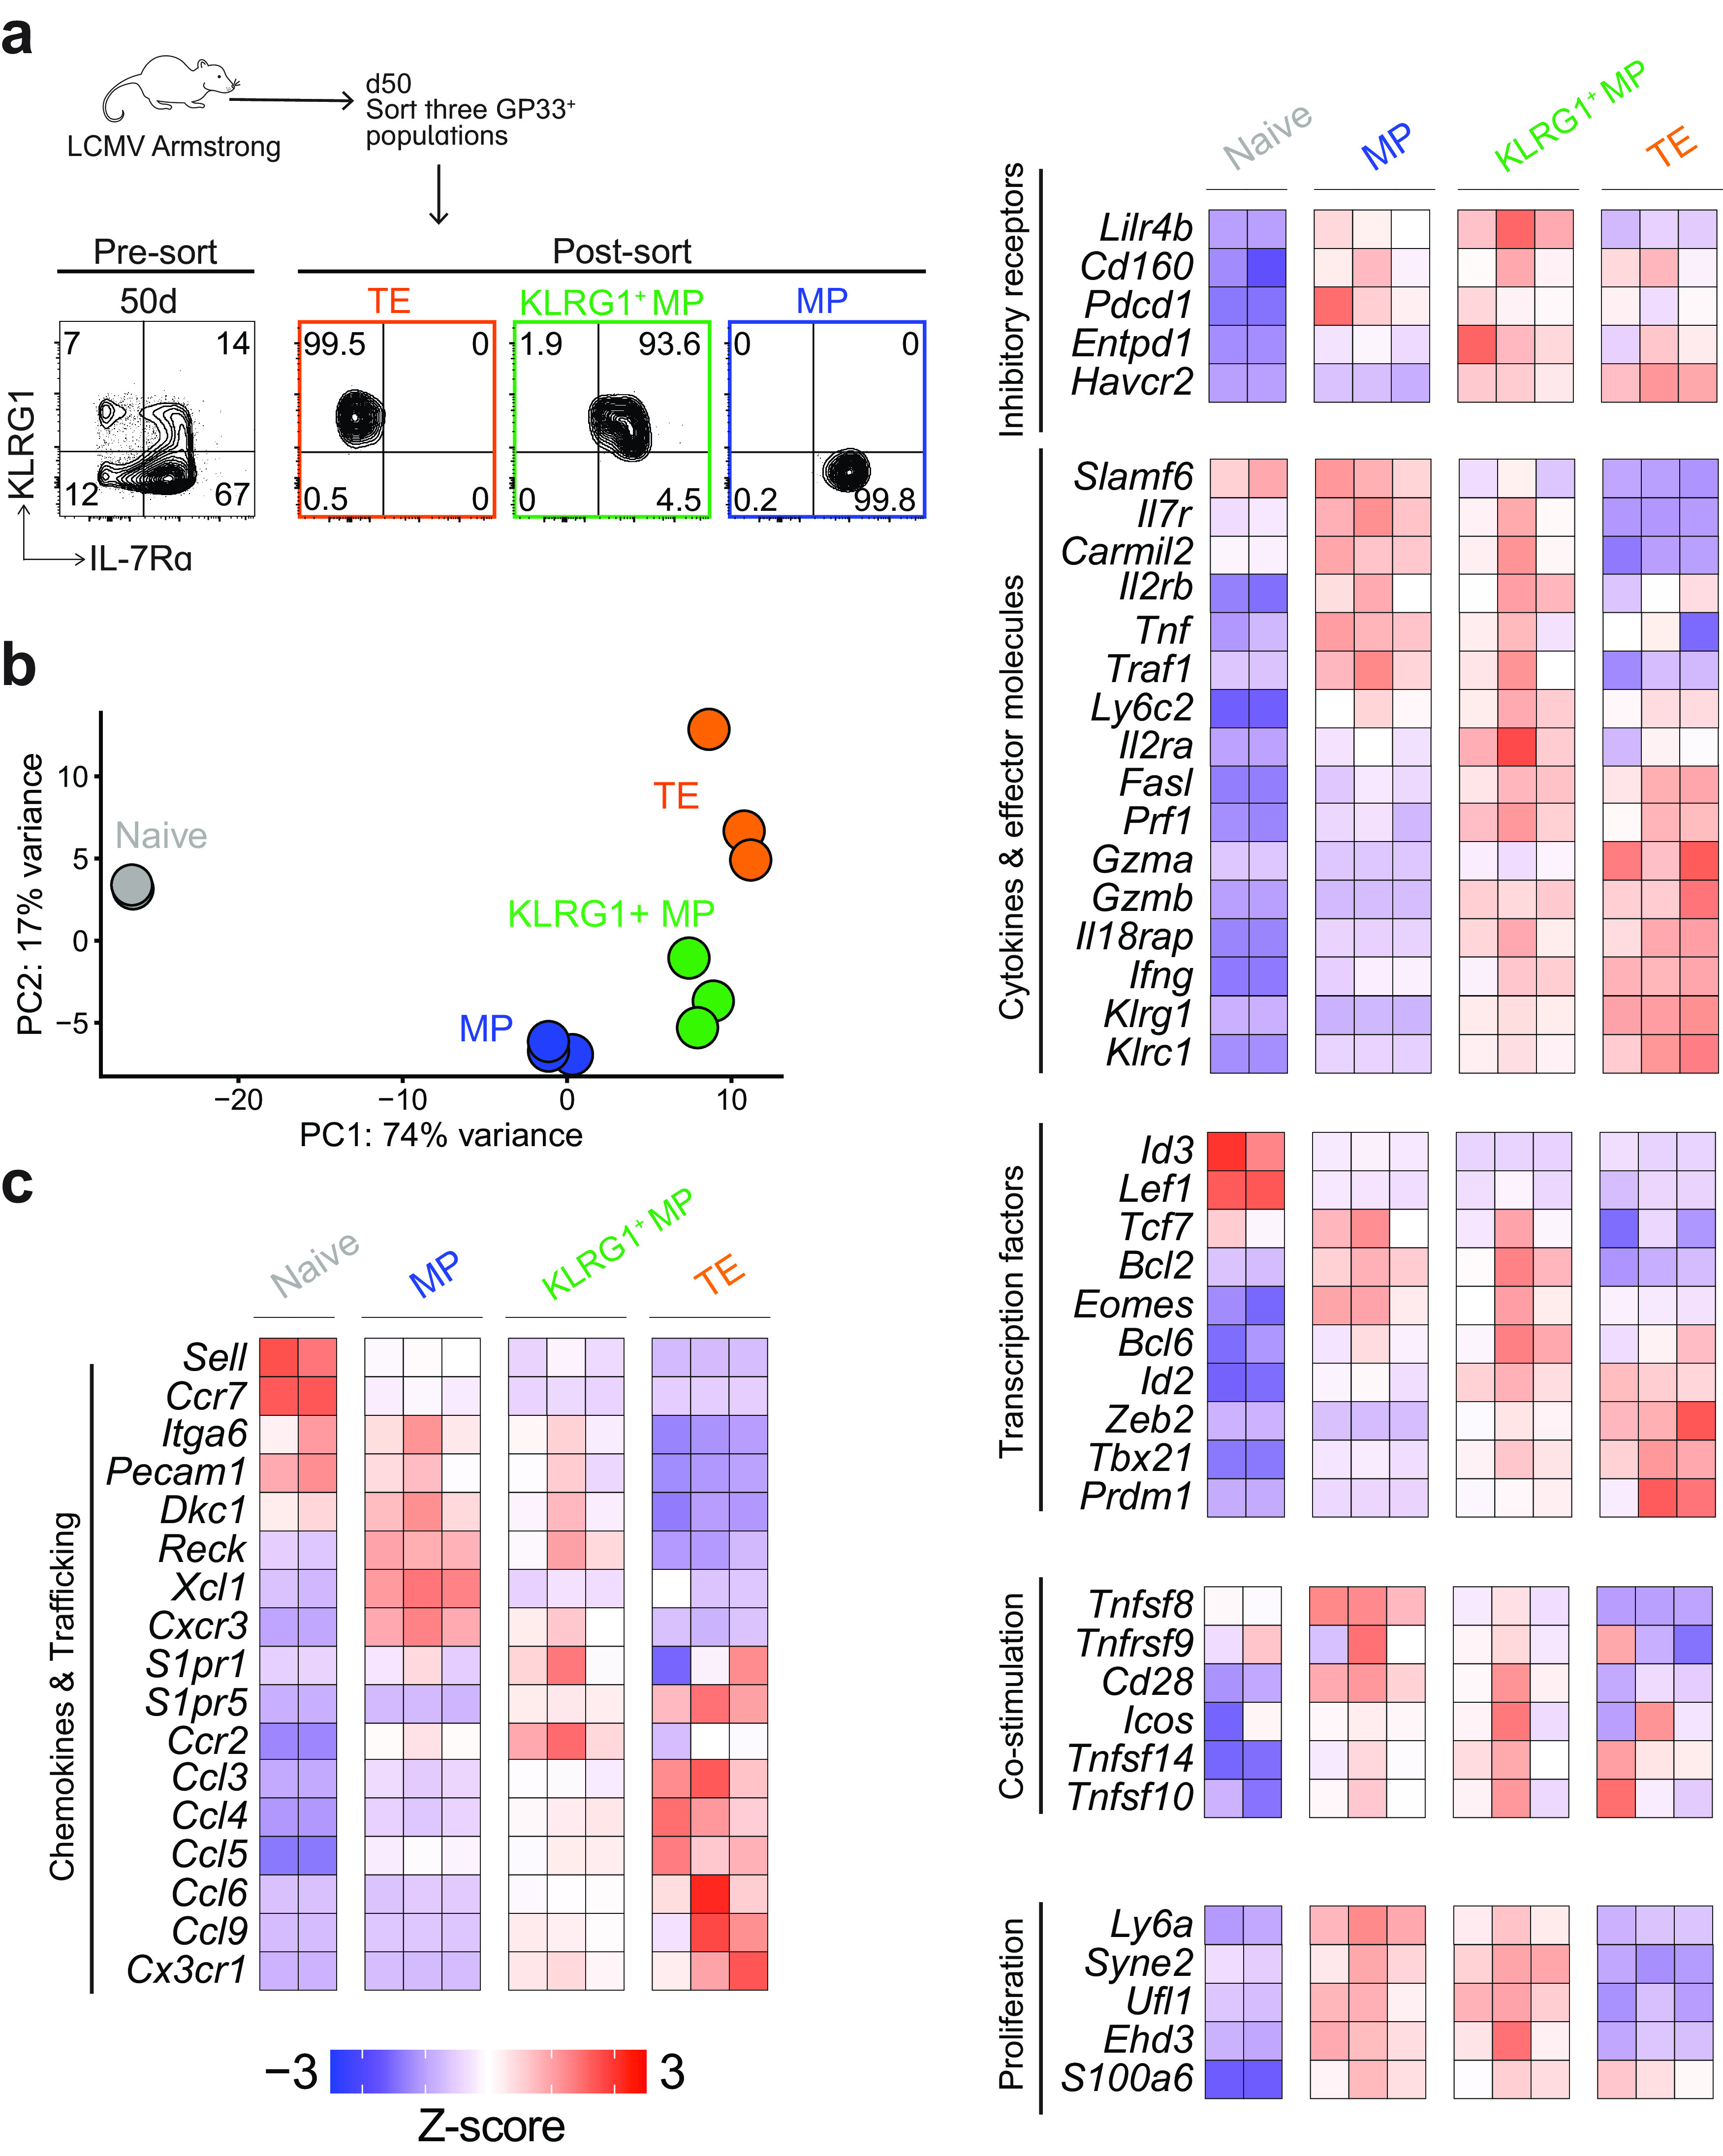
FIG 4.

Transcriptional profile of three KLRG1/IL-7Rα CD8 T cell subsets after acute infection. (a) RNA was isolated from three sorted subsets (MPs, KLRG1+ MPs, and TEs) and submitted for RNA-seq. Representative flow plots showing purity (>93%) of the three subsets before and after sorting. Each subset was sorted from bulk GP33+ CD8 T cells at day 50 postinfection. Three sets of three mice were pooled, and then the three subsets were isolated from each pooled sample. (b) Principal-component analysis (PCA) identified two principal components that explained 91% of variance between the samples. Each sample is plotted on these two components. (c) Heatmap showing Z-scores of top DEGs and other genes of interest across the three memory subsets.
