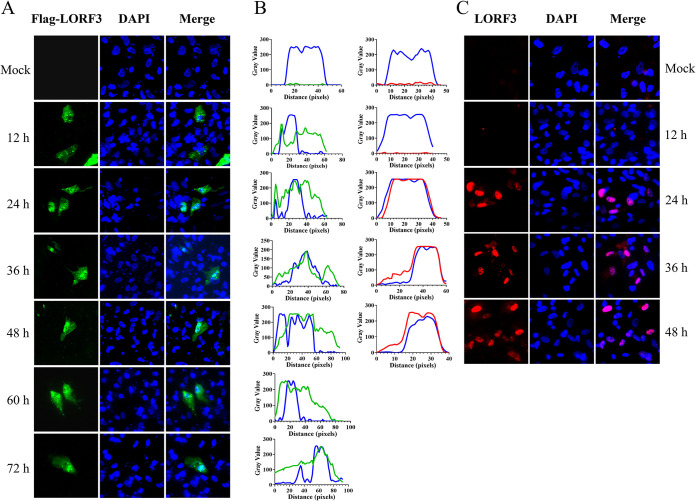
FIG 3.
Intracellular localization and distribution of LORF3-encoded protein. (A) Localization of overexpressed pLORF3 (green in images) in the mock group includes DEF cells transfected with pCAGGS empty, using Flag-tagged monoclonal antibody (MAb) and Alexa Fluor 488 goat anti-mouse IgG. DAPI, 4′,6-diamidino-2-phenylindole. (B) Fluorescence waveform analysis diagram of protein expression. Analysis was performed using ImageJ and GraphPad Prism8 software. (C) Representative DPV pLORF3 localization (red in images). The mock group included untreated DEF cells using rabbit anti-LORF3 polyclonal antibody and Alexa Fluor 594 goat anti-rabbit IgG (scale bar, 10 μm).

