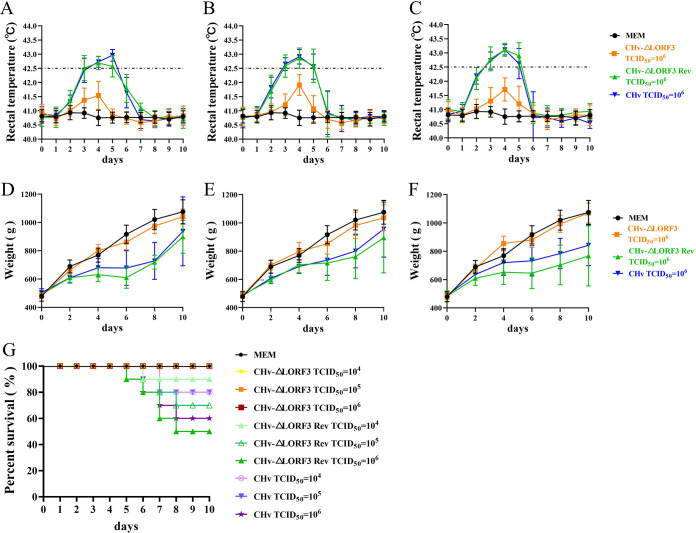
FIG 7.
Pathogenesis of deletion, reversion, and parental viruses. (A to C) Rectal temperature of DPV-inoculated ducks. The temperature of all ducks inoculated with 104, 105, and 106 TCID50 doses were monitored daily for 10 dpi, and the trend curve for each group was plotted. (D to F) Body weight gain rate of ducks inoculated with DPV. The weights of all ducks infected with 104, 105, and 106 TCID50 doses were monitored for 10 days, and weight trend curves were drawn. (G) Survival curve of DPV inoculated ducks. Mortalities of all groups were recorded daily for 10 dpi, and the survival rates for each group were graphed.

