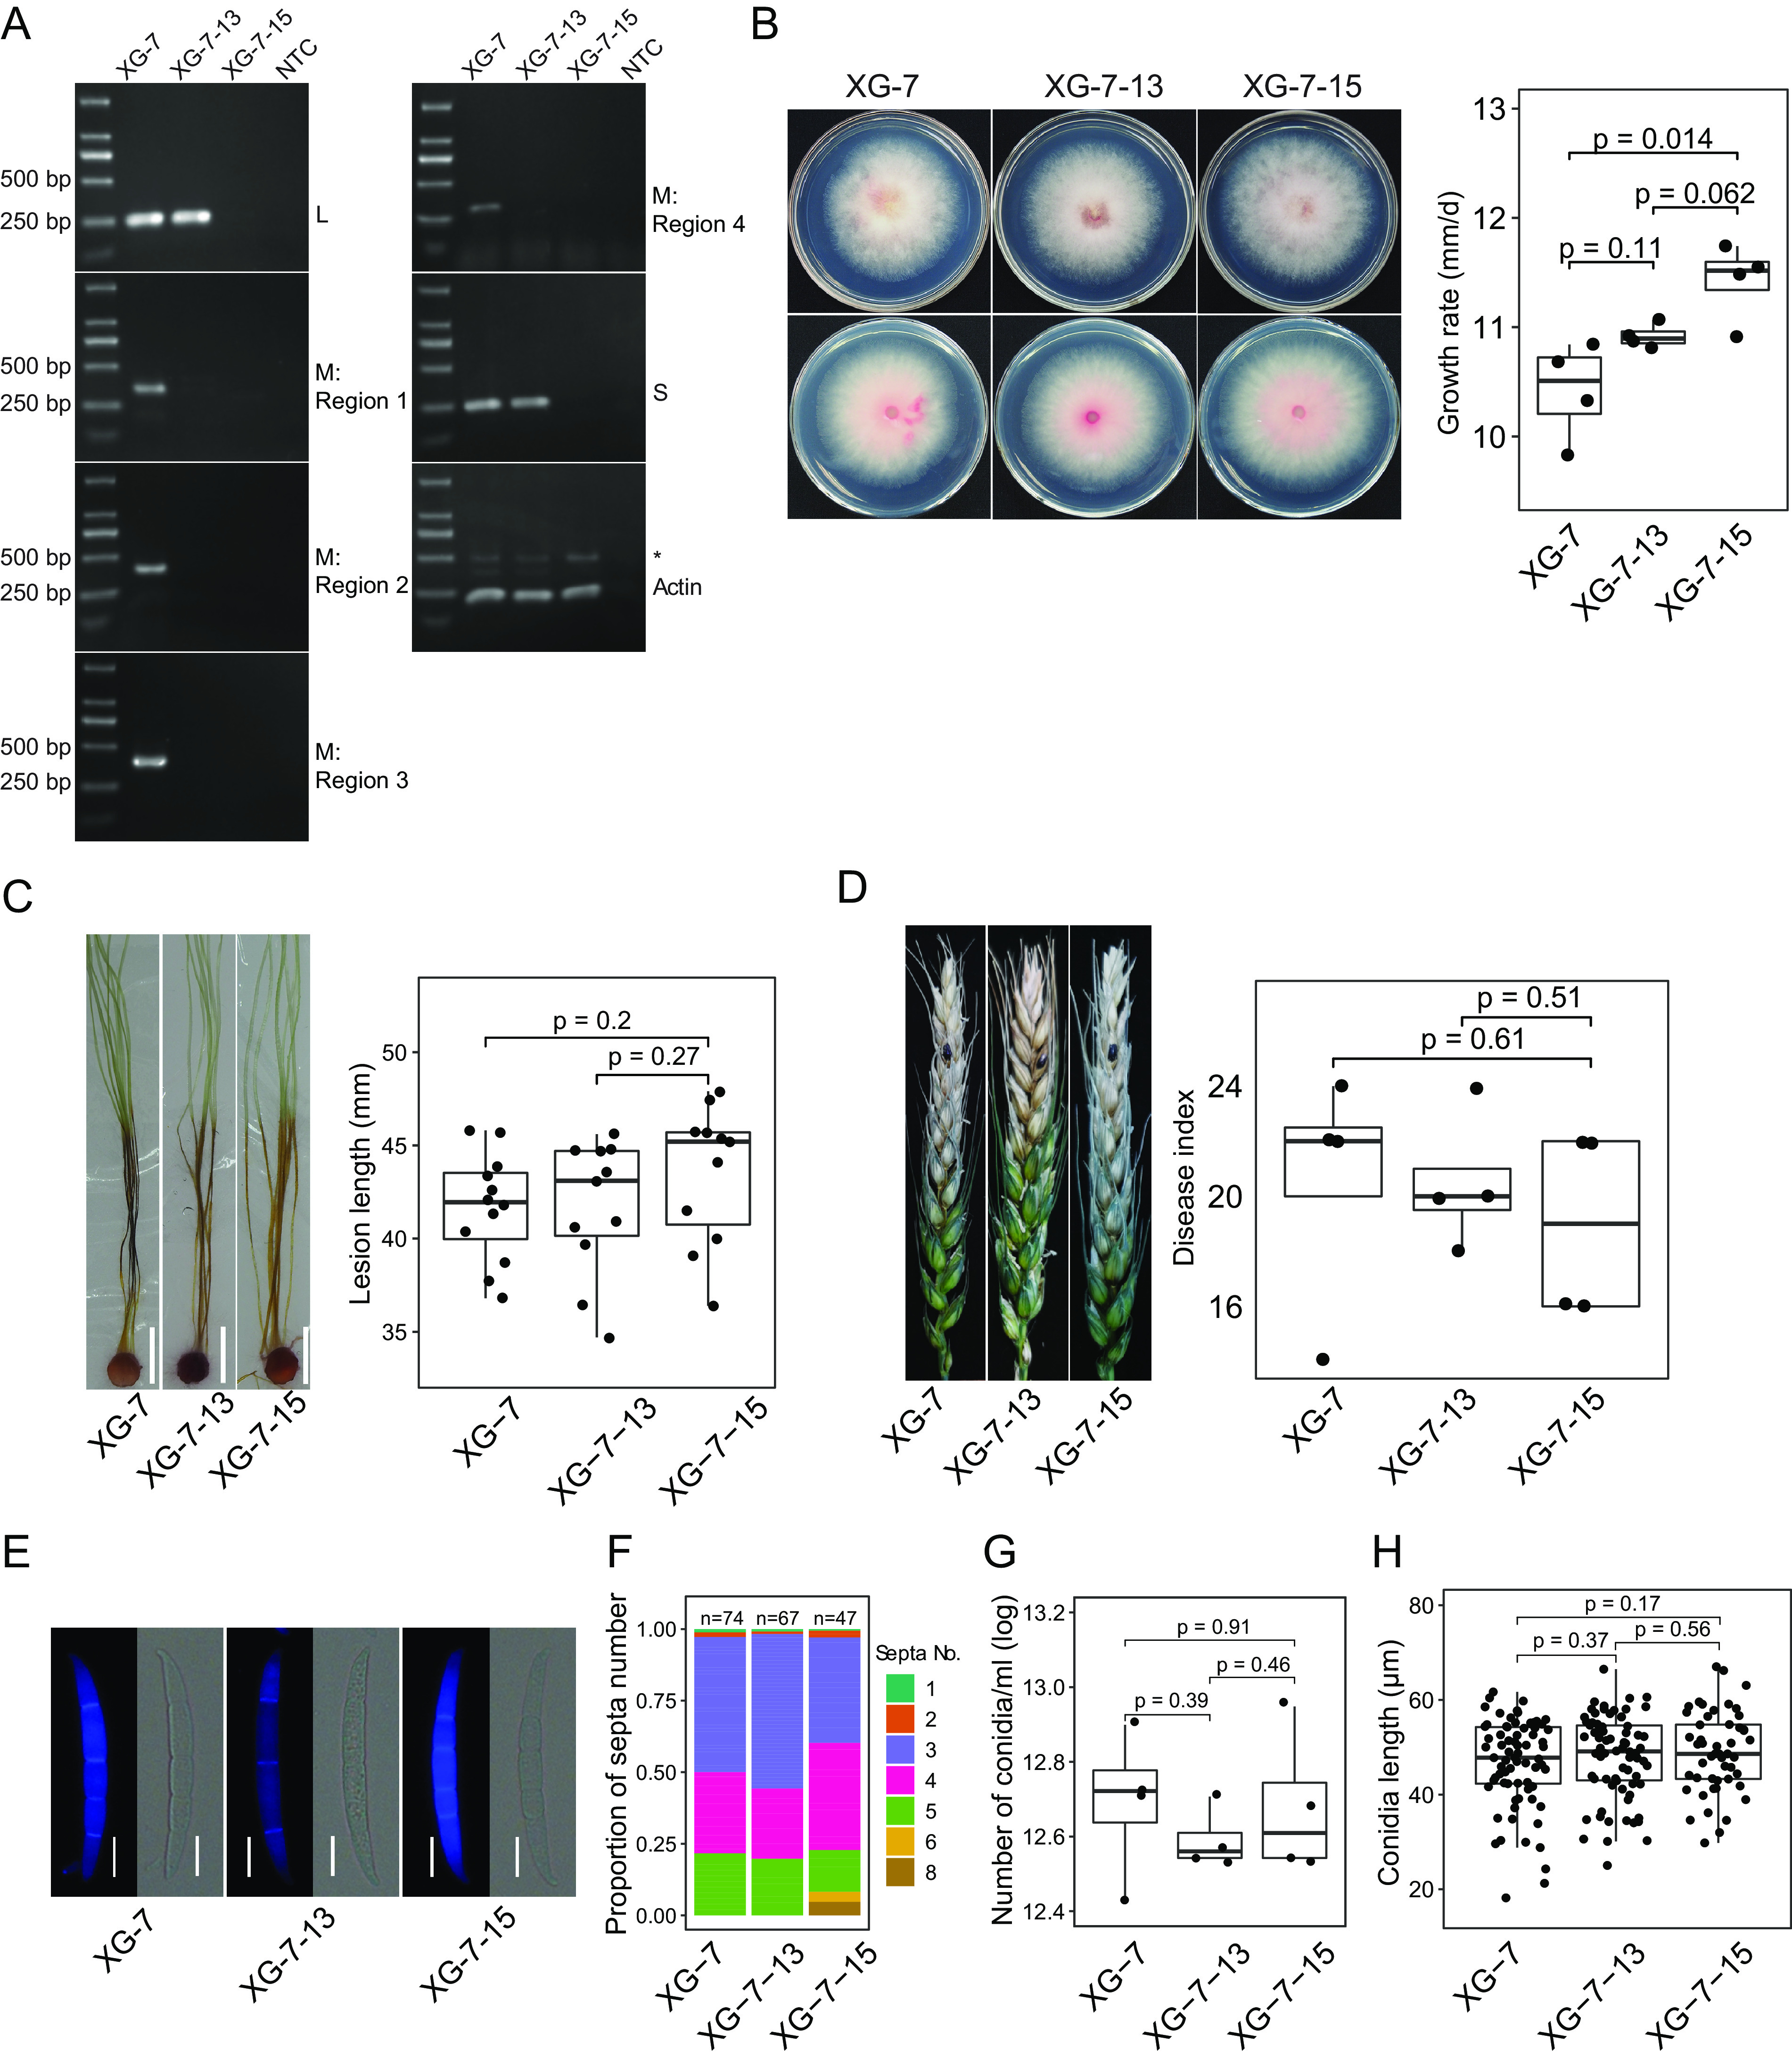
FIG 6.

Vertical transmission of FaMBV1 and its effects on biological features of F. asiaticum. (A) RT-PCR detection of FaMBV1 L, M, and S segments in asexual spore progeny with virus-specific primers. Four different regions, as shown in Fig. 2A, were included for the detection of the M segment in XG-7-13 to exclude negative RT-PCR results from small deletions. The actin gene was used as a control. NTC, no-template control. A larger band (*) above the actin band was amplified from the genomic DNA. (B) (Left) Colony morphology after 3 days of incubation at 28°C. XG-7-13 was infected with L and S segments of FaMBV1. XG-7-15 was free of FaMBV1. The front and reverse sides of the colony are presented. (Right) Boxplot showing the growth rates of XG-7, XG-7-13, and XG-7-15. Student’s t test was used for the statistical test. (C) (Left) Corn silks inoculated with the mycelium plugs of strains XG-7, XG-7-13, and XG-7-15 were examined after 5 days. White bar, 1 cm. (Right) Lesion length of XG-7, XG-7-13, and XG-7-15 inoculated on the corn silk. P values were derived from the Student t test. (D) (Left) Representative picture of wheat heads of cultivar XiaoYan 22 inoculated with mycelium plugs. (Right) Boxplot showing disease index measured at 14 days post-inoculation (dpi). P values were derived from the Student t test. (E) Representative conidia of the strains stained using calcofluor white for septa. Bars, 10 μm. (F) The proportion of the septum number is shown in the bar plot, and total conidial number is indicated on the top of the bar. (G) Conidial production in mung bean soup medium. The conidial numbers were transformed with logarithms for the Student t test. (H) Boxplot shows the conidium length. Significance analysis was performed using the Student t test.
