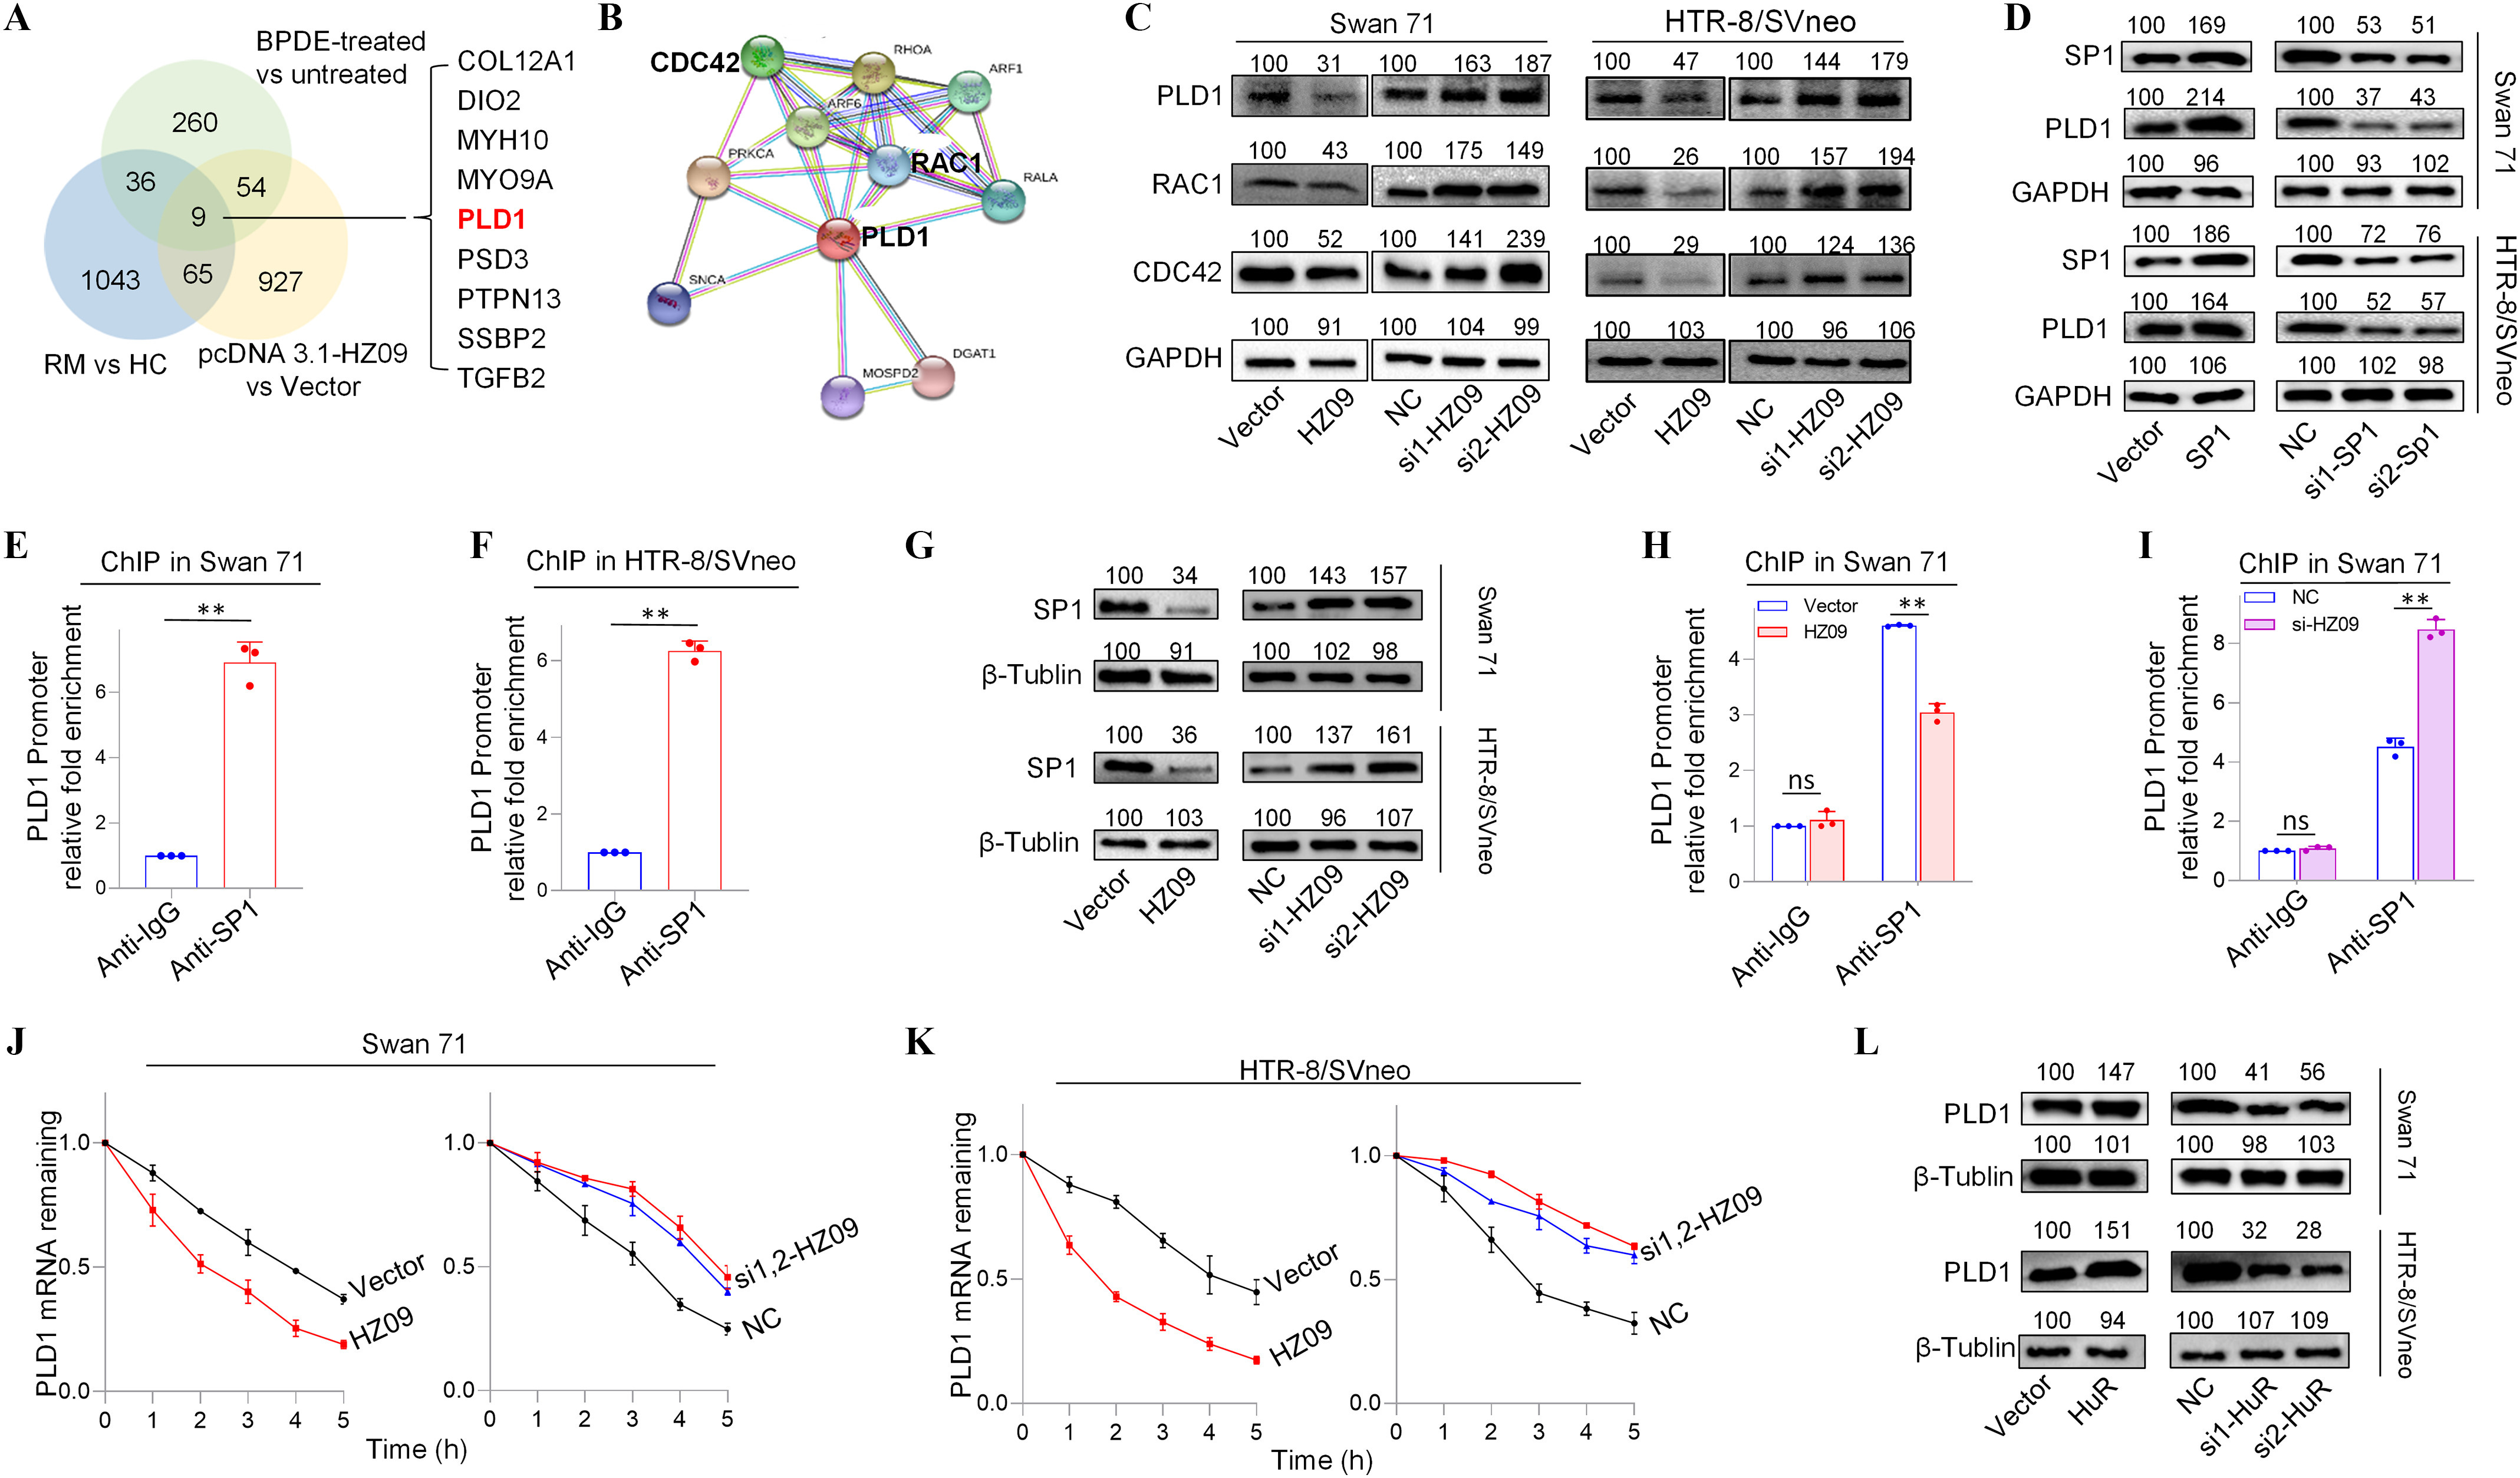
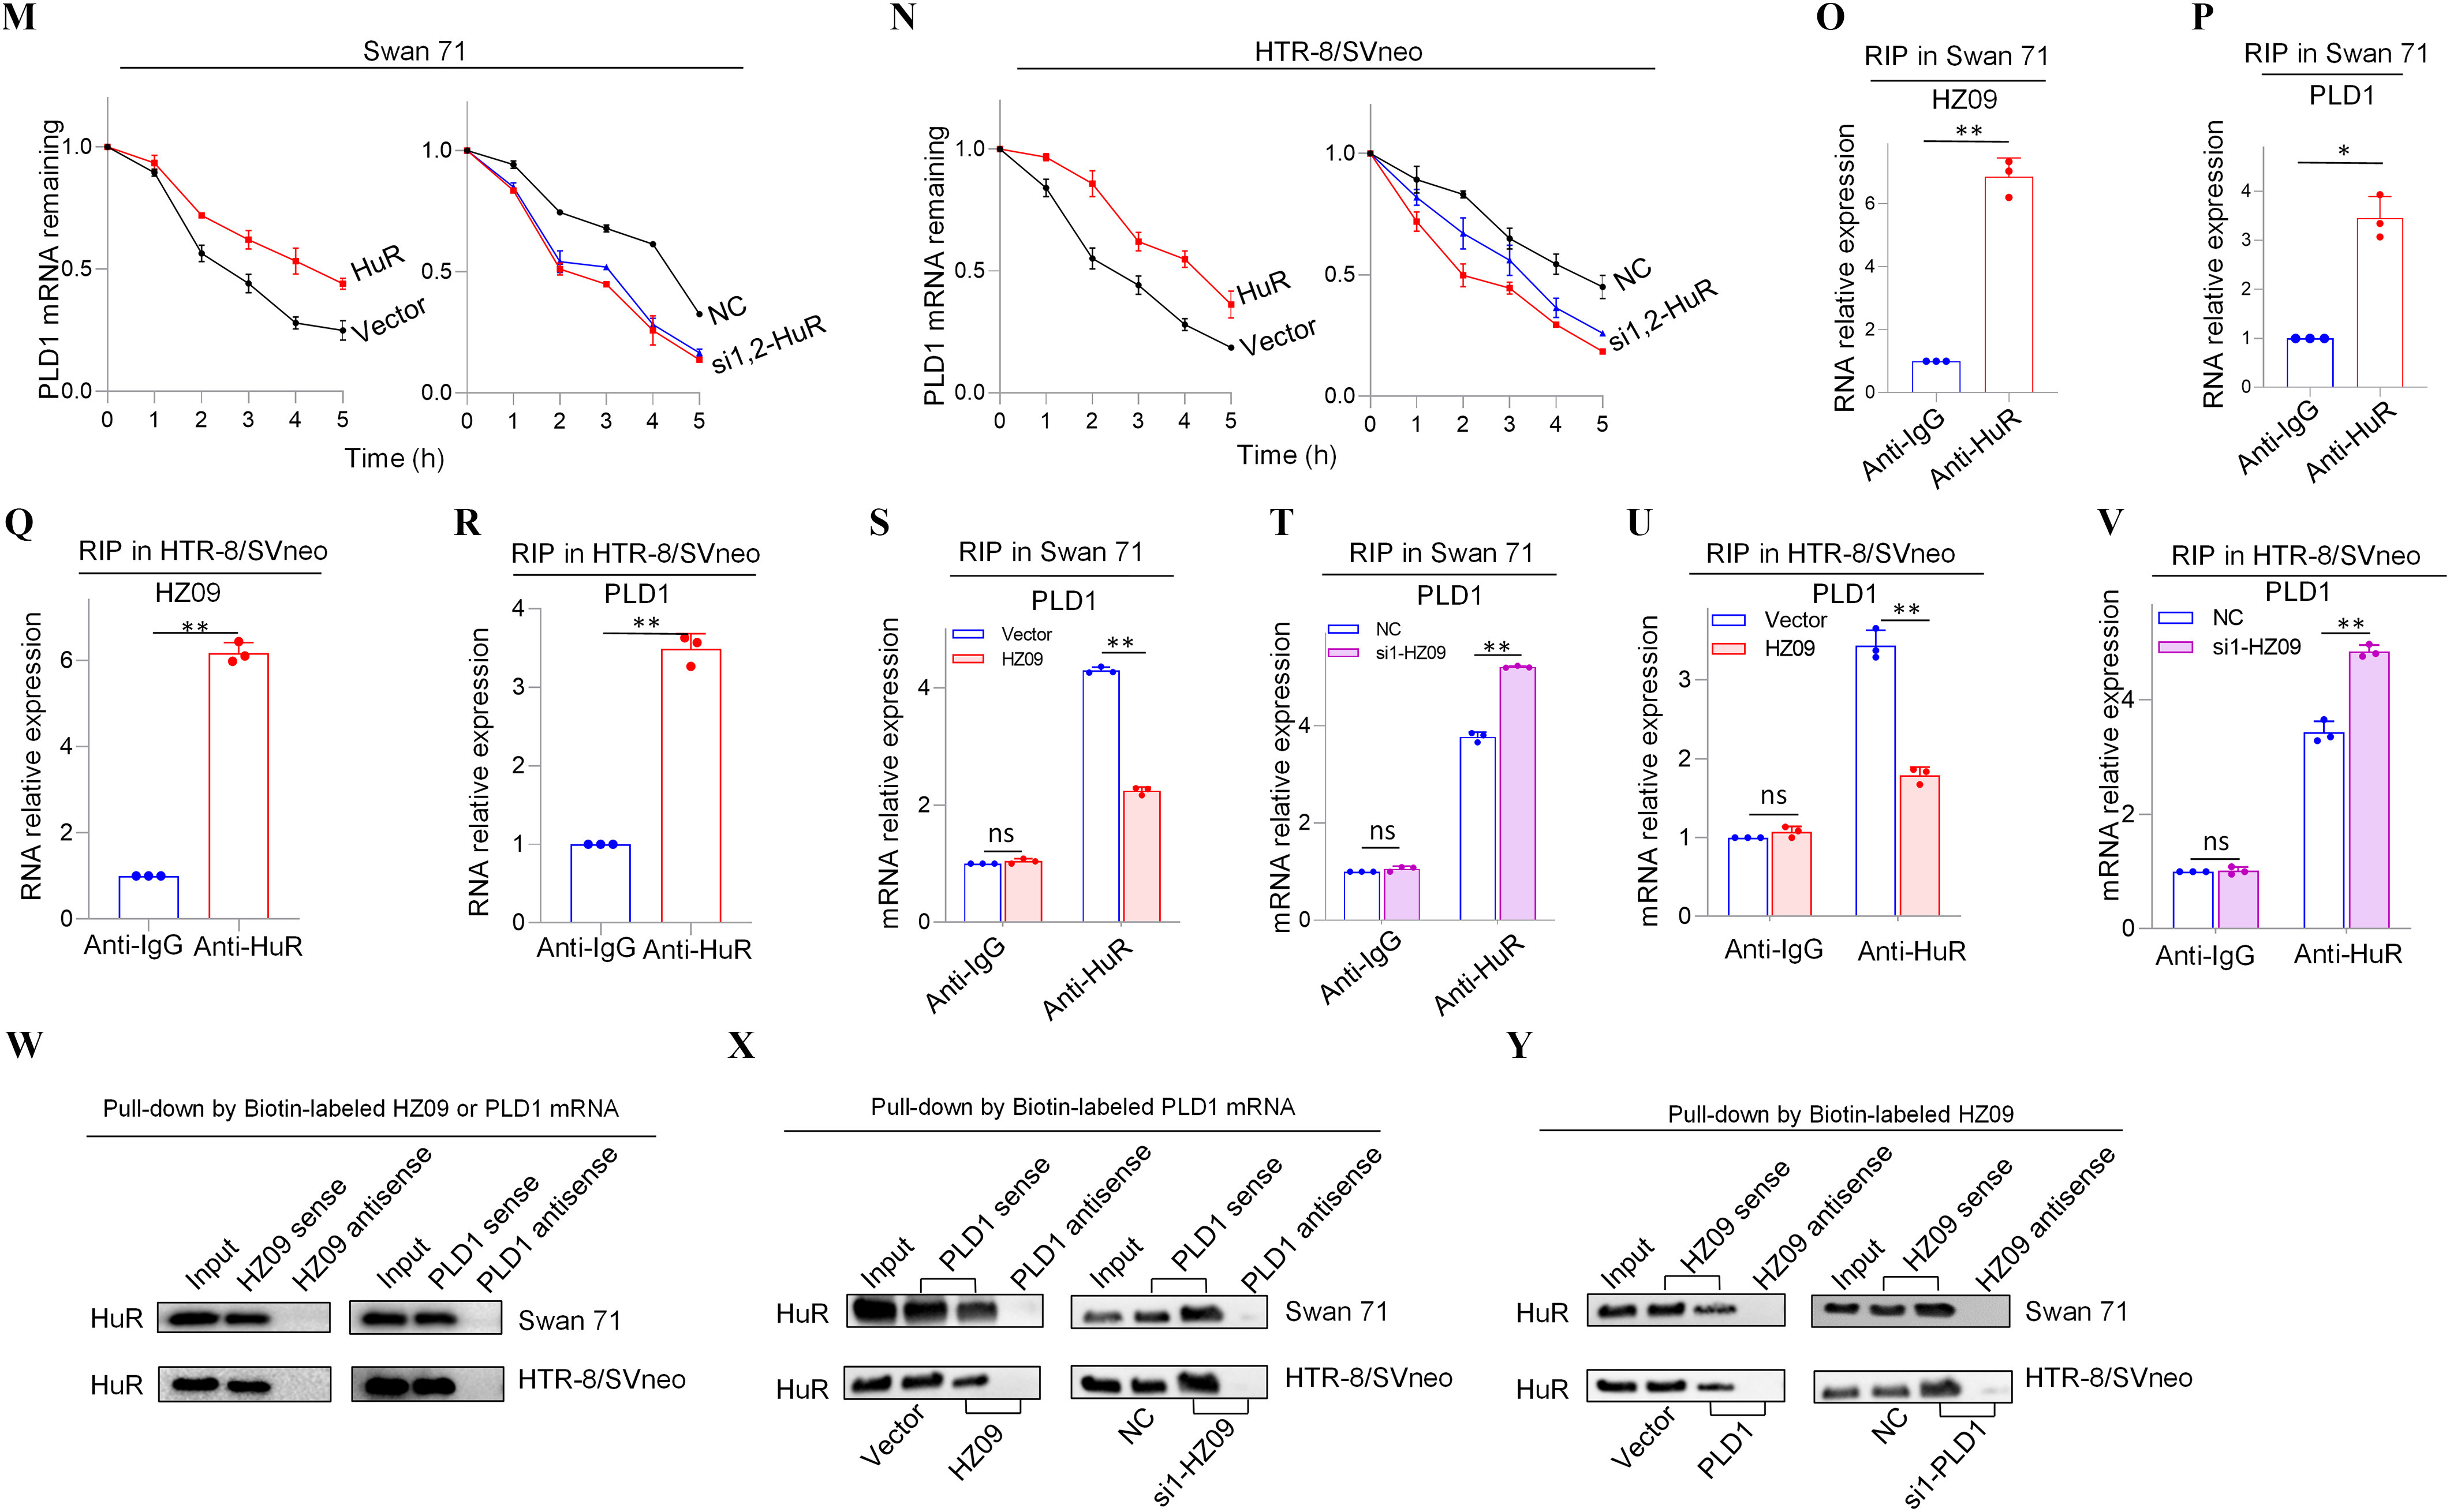
Figure 2.


Expression levels of members of PLD1/RAC1/CDC42 pathway regulated by lnc-HZ09 in human trophoblast cells. (A) The significantly down-regulated mRNAs in the intersection of mRNA sequencing data of BPDE-treated vs. untreated Swan 71 cells, lnc-HZ09-overexpressed vs control Swan 71 cells, and RM vs HC villous tissues. (B) String analysis of PLD1, RAC1 and CDC42. (C) Representative western blot analysis of the protein levels of PLD1, RAC1 and CDC42 in Swan 71 or HTR-8/SVneo cells with overexpression or knockdown of lnc-HZ09, with GAPDH as internal standard. The relative intensity of each band was quantified and the of three replicates was shown in Figure S3A. (D) Representative western blot analysis of the protein levels of SP1 and PLD1 in Swan 71 or HTR-8/SVneo cells with overexpression or knockdown of SP1, with GAPDH as internal standard. The relative intensity of each band was quantified and the of three replicates was shown in Figure S3G. (E–F) SP1 ChIP assay analysis (each ) of the relative enrichment of SP1 in the promoter region of PLD1 gene in Swan 71 (E) or HTR-8/SVneo (F) cells. (G) Representative western blot analysis of the protein levels of SP1 in Swan 71 or HTR-8/SVneo cells with overexpression or knockdown of lnc-HZ09, with as internal standard. The relative intensity of each band was quantified and the of three replicates was shown in Figure S3H. (H–I) SP1 ChIP assay analysis (each ) of the relative enrichment of SP1 in the promoter region of PLD1 gene in Swan 71 cells with overexpression (H) or knockdown (I) of lnc-HZ09. (J–K) The mRNA stability of PLD1 (each ) in Swan 71 (J) or HTR-8/SVneo (K) cells with overexpression or knockdown of lnc-HZ09. (L) Representative western blot analysis of the protein levels of PLD1 in Swan 71 or HTR-8/SVneo cells with overexpression or knockdown of HuR, with as internal standard. The relative intensity of each band was quantified and the of three replicates was shown in Figure S5E. (M–N) The mRNA stability of PLD1 (each ) in Swan 71 (M) or HTR-8/SVneo (N) cells with overexpression or knockdown of HuR. (O–R) RIP assay analysis (each ) of the relative levels of lnc-HZ09 (O and Q) or PLD1 mRNA (P and R) that was pulled down by HuR protein in Swan 71 (O and P) or HTR-8/SVneo (Q and R) cells. (S–V) RIP assay analysis (each ) of the relative levels of PLD1 mRNA that was pulled down by HuR protein in Swan 71 (S and T) or HTR-8/SVneo (U and V) cells with overexpression (S and U) or knockdown (T and V) of lnc-HZ09. (W) Representative western blot analysis of HuR that was pulled down by biotin-labeled lnc-HZ09 or PLD1 mRNA in Swan 71 or HTR-8/SVneo cells in pull-down assays. (X) Representative western blot analysis of HuR that was pulled down by biotin-labeled PLD1 mRNA in Swan 71 or HTR-8/SVneo cells with overexpression or knockdown of lnc-HZ09 in pull-down assays. (Y) Representative western blot analysis of HuR that was pulled down by biotin-labeled lnc-HZ09 in Swan 71 or HTR-8/SVneo cells with overexpression or knockdown of PLD1 in pull-down assays. The summary data of these bar charts and diagrams were shown in Excel Table S1. The expression level in NC or Vector group was set as “1” in all of mRNA stability assays; the levels of DNA or RNA pulled down by IgG were set as “1” in all of ChIP and RIP assays, respectively; and the band intensity in NC or Vector group was set as ‘100’ in all of western blot assays. C,D,G,L,W–Y show the representative data from three independent experiments. Data in (E–F, H–K, M–V) show of three independent experiments. Two-tailed Student’s -test for (E–F,H–I,O–V); *, **. Note: BPDE, benzo(a)pyrene-7,8-dihydrodiol-9,10-epoxide; ChIP, chromatin immunoprecipitation; GADPH, glyceraldehyde-3-phosphate dehydrogenase; HC, healthy control; HuR, overexpression of HuR; HZ09, overexpression of lnc-HZ09; NC, negative control of siRNA; ns, nonsignificance; PLD1, phospholipase D hydrolyze 1; RIP, RNA immunoprecipitation; RM, recurrent miscarriage; SD, standard deviation; si-HuR, knockdown of HuR; si-SP1, knockdown of SP1; SP1, overexpression of SP1; Vector, empty vector of pcDNA3.1; si-HZ09, knockdown of lnc-HZ09.
