. 2023 Jan 31;131(1):017009. doi: 10.1289/EHP10477

Figure 5.

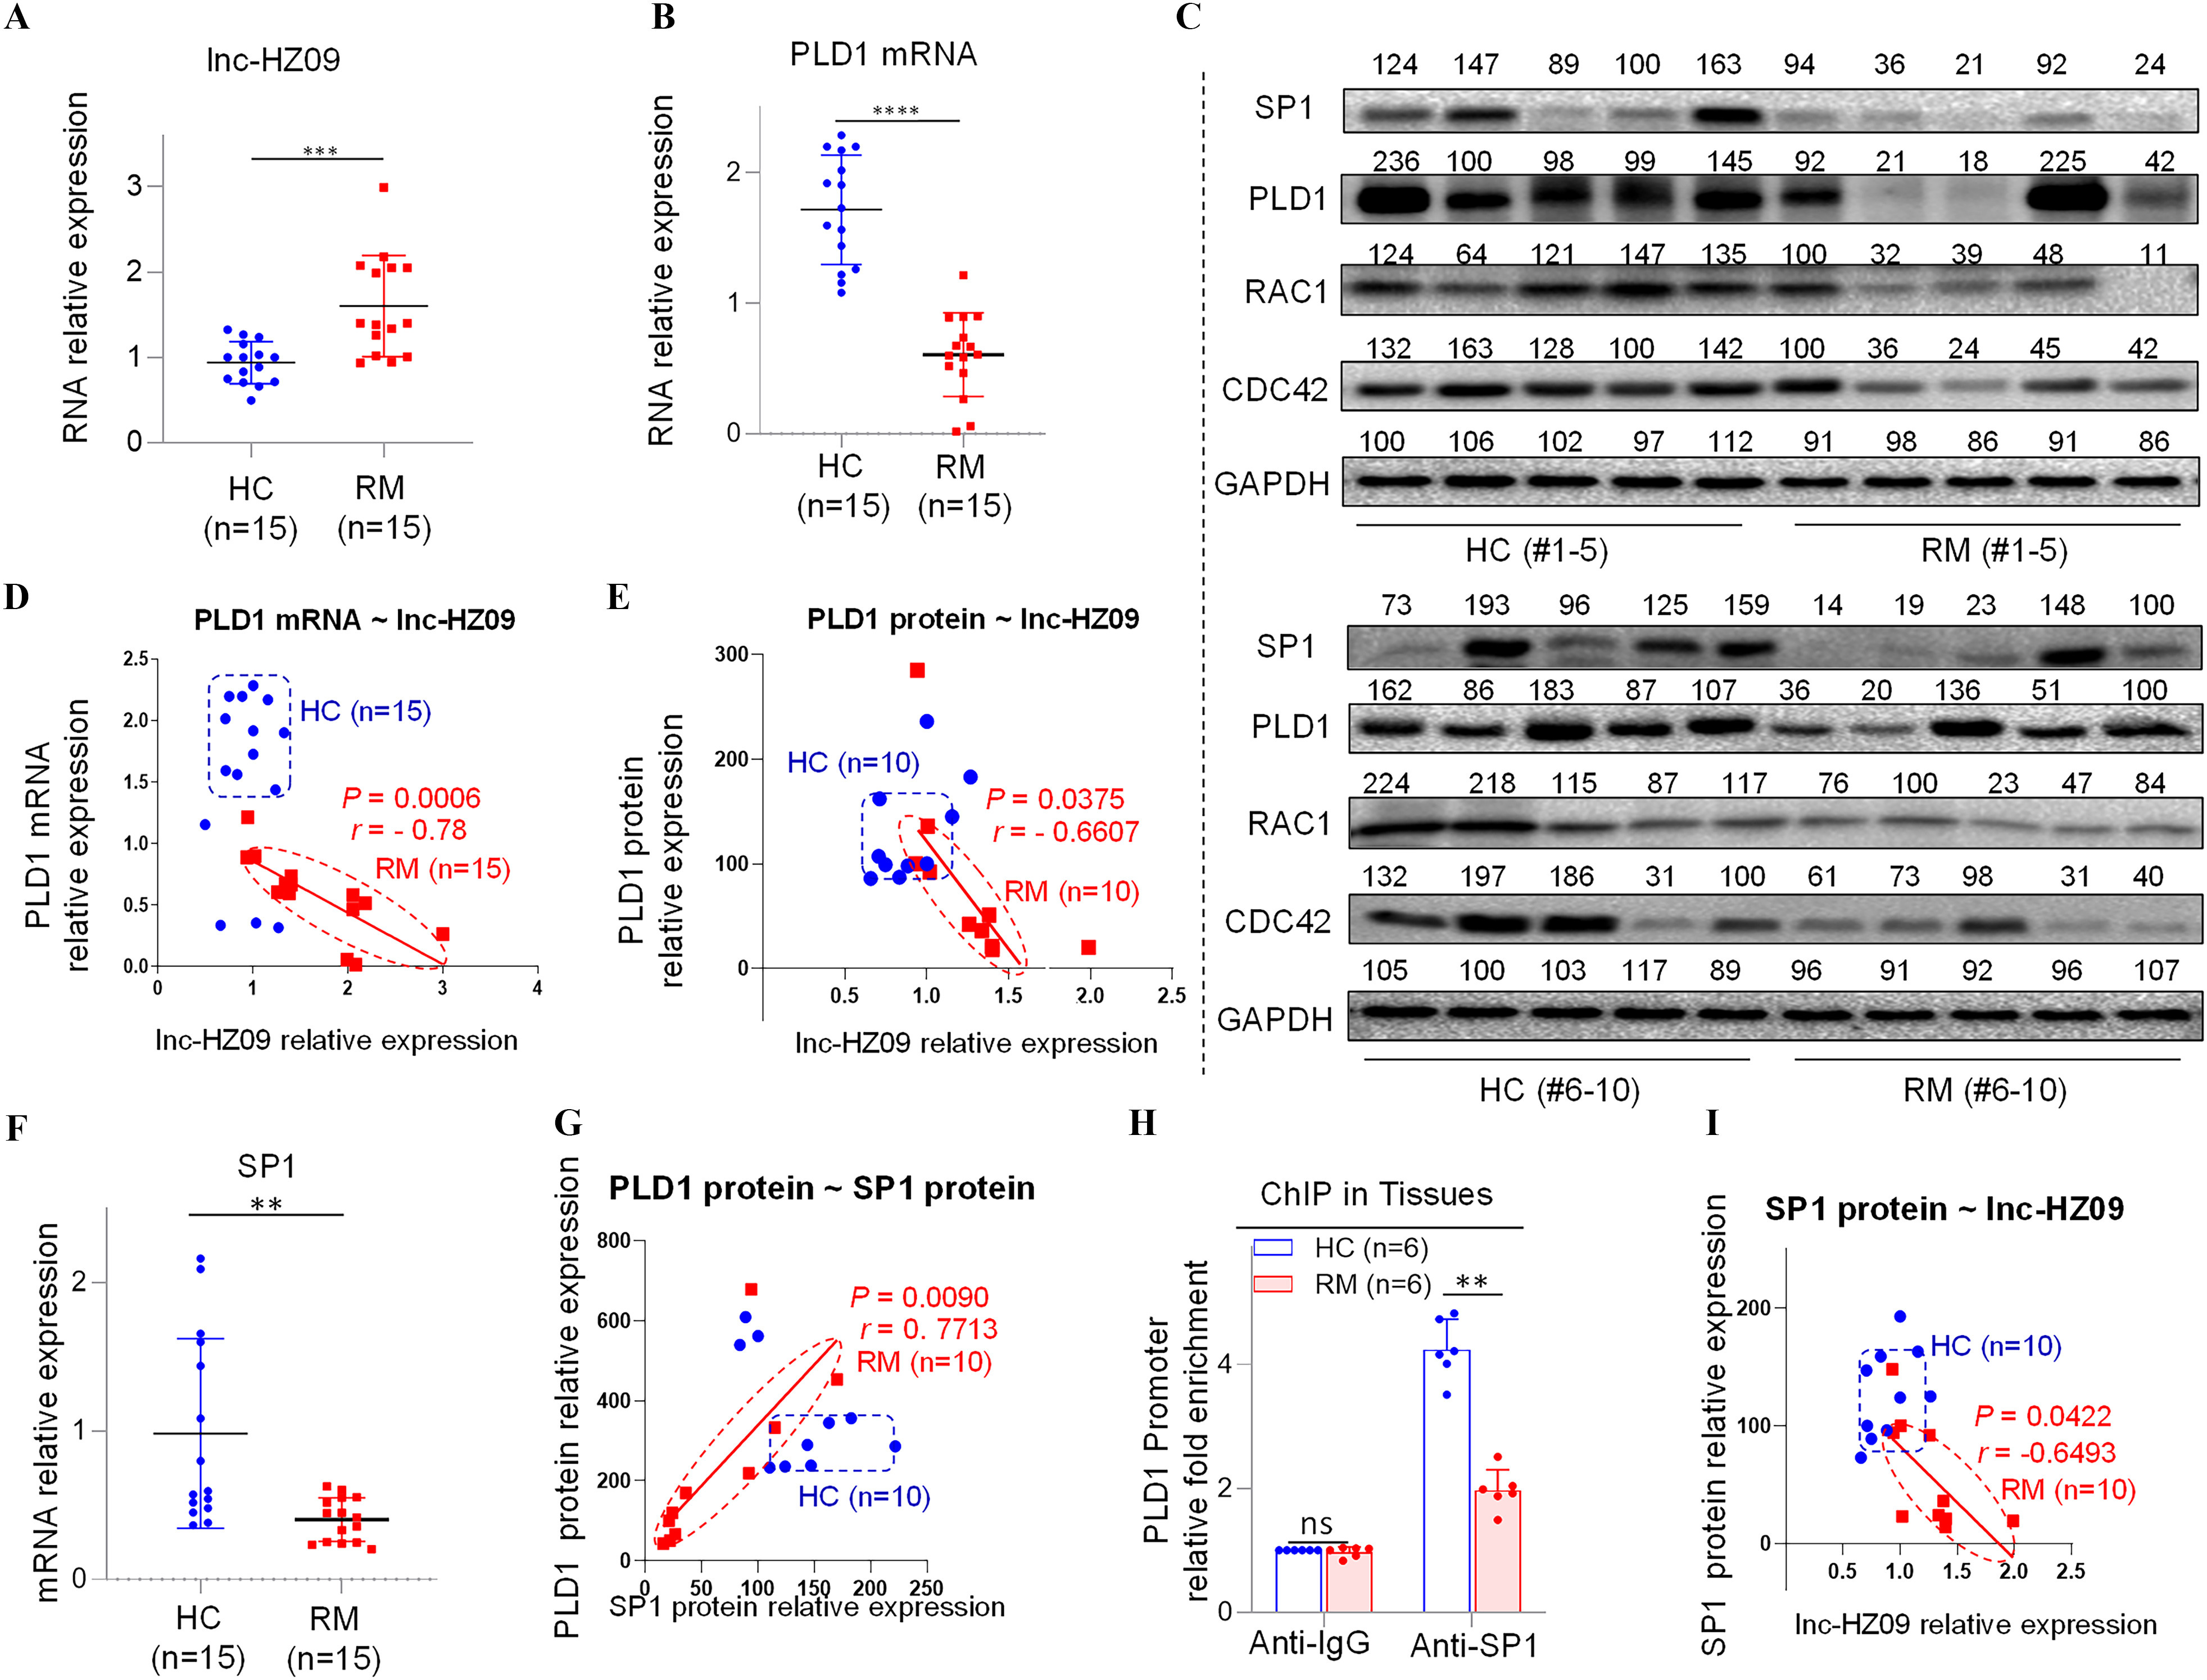
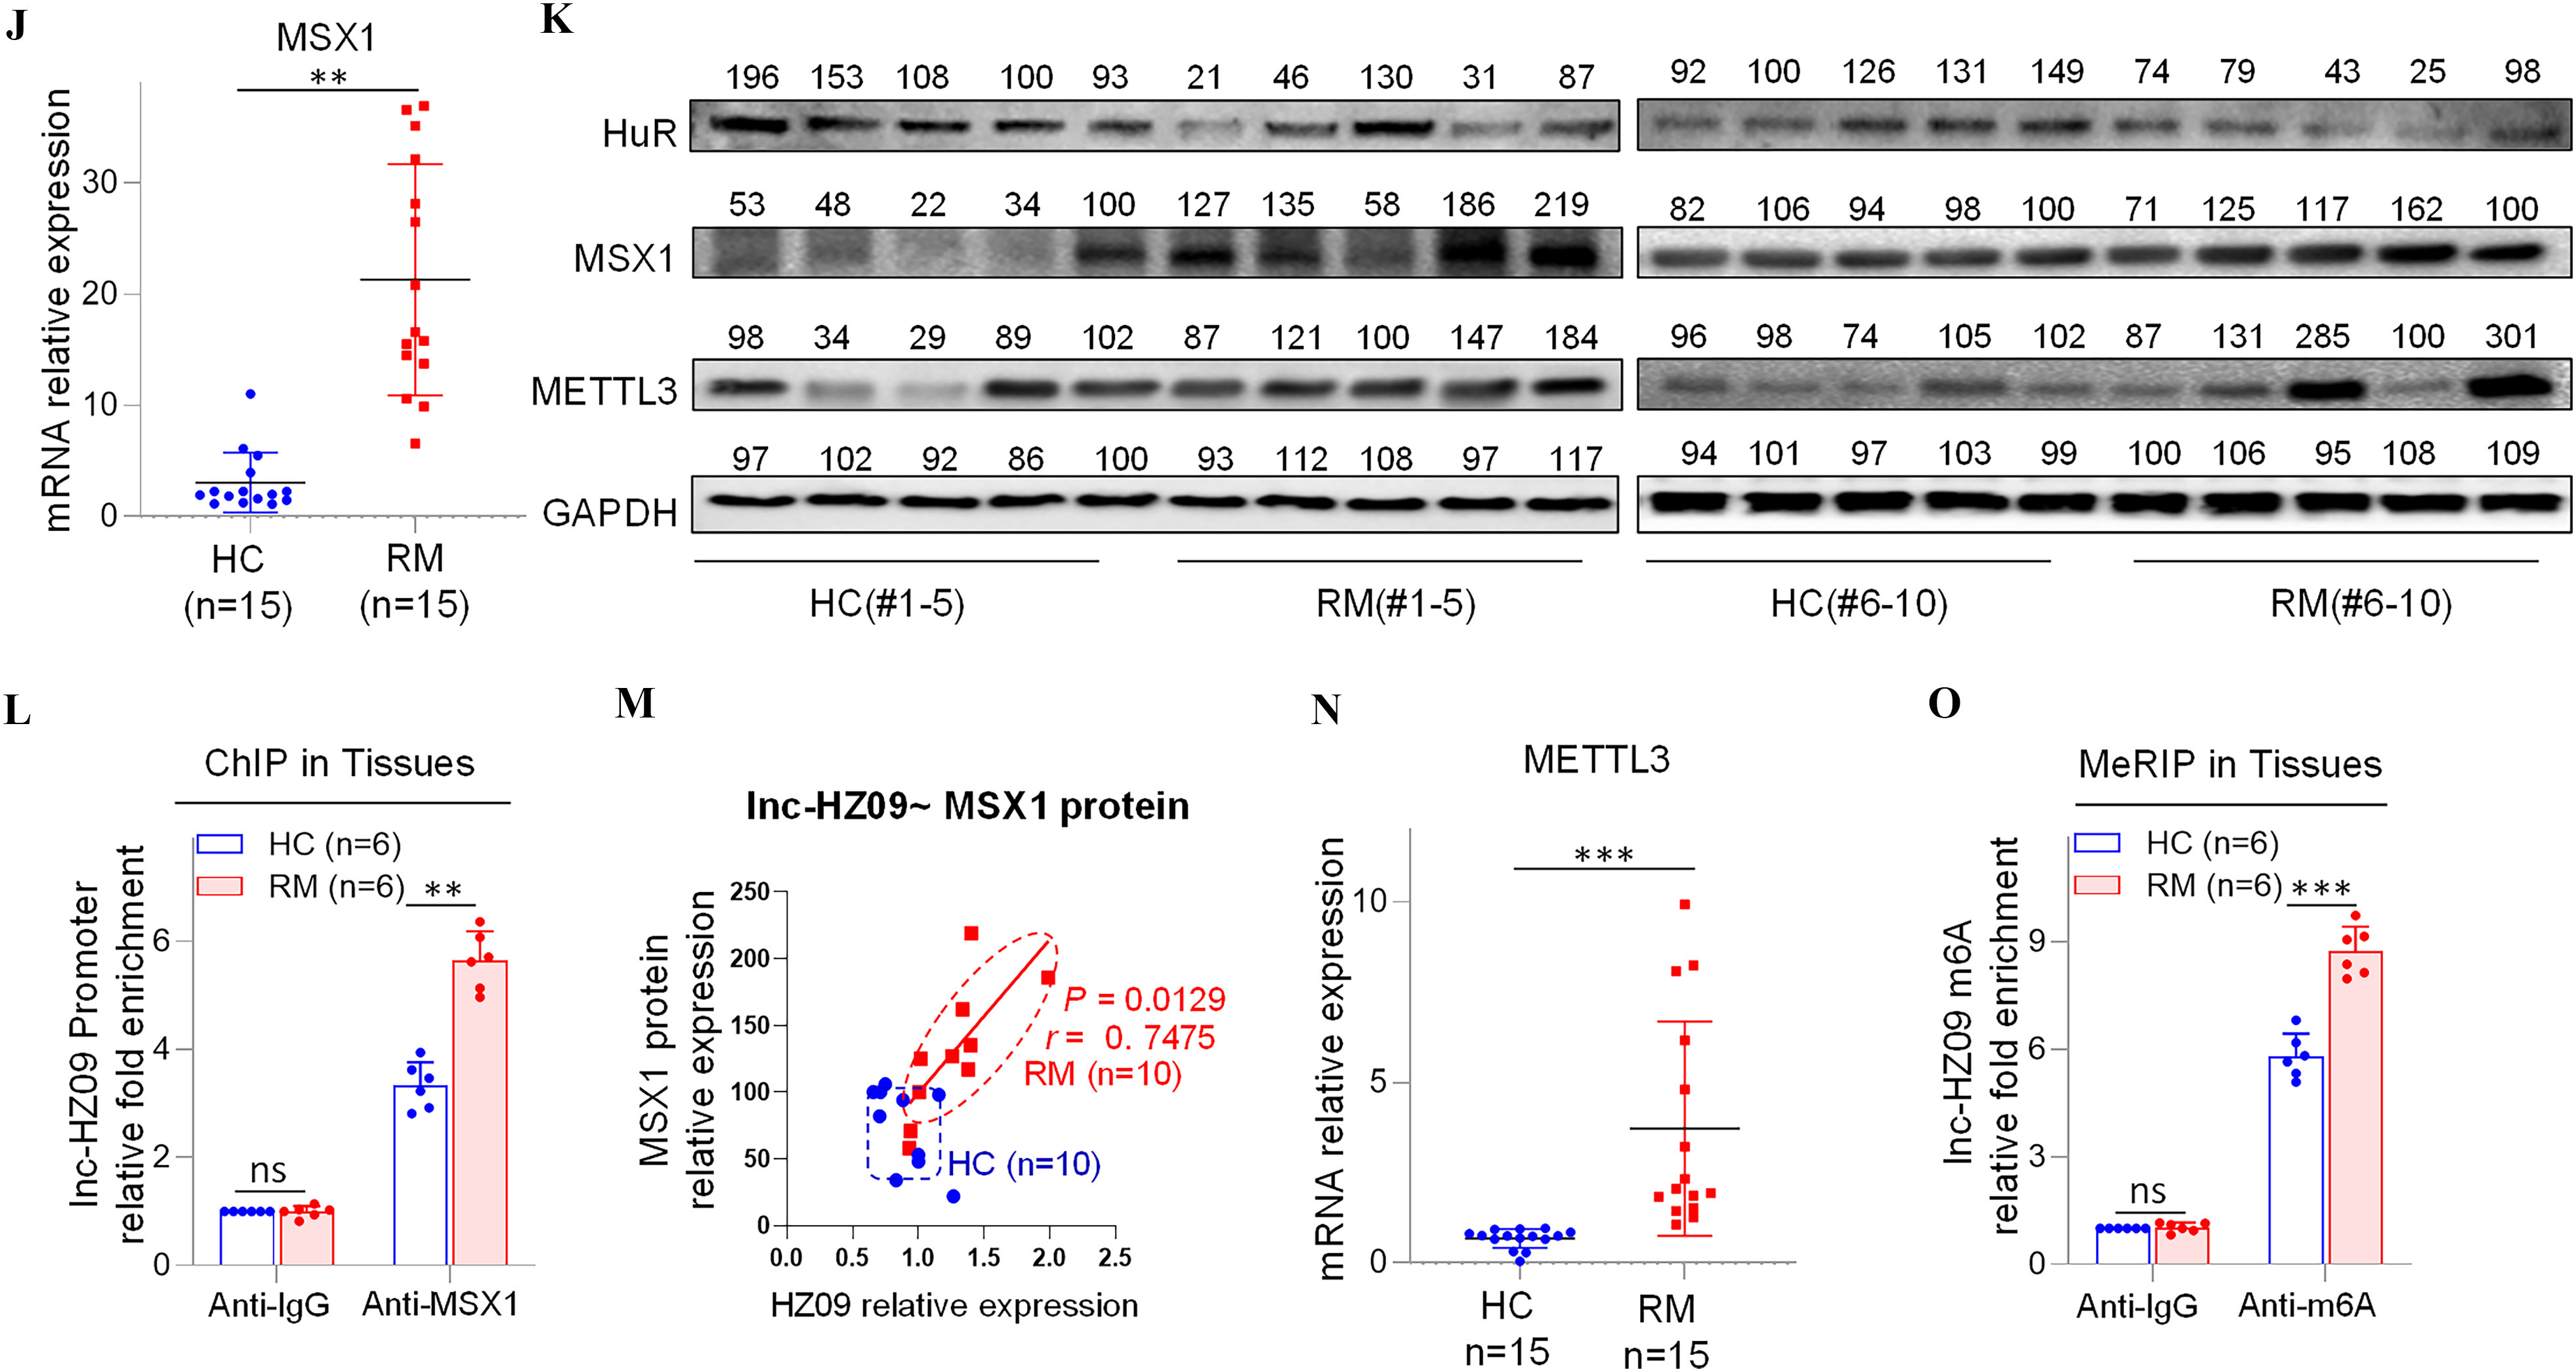
Figures 5A, 5B, 5F, 5N are error bar graphs titled Inc-HZ 09, Phospholipase D1 messenger ribonucleic acid, specificity protein 1, m(6)A methyltransferase, plotting ribonucleic acid relative expression, ranging from 0 to 3 in unit increments, ribonucleic acid relative expression, ranging from 0 to 2 in unit increments, messenger ribonucleic acid relative expression, ranging from 0 to 2 in unit increments, and messenger ribonucleic acid relative expression, ranging from 0 to 10 in increments of 5 (y-axis) across H C and R M (x-axis), respectively. Figures 5D, 5E, 5G, 5I, 5M are graphs titled Phospholipase D1 messenger ribonucleic acid-Inc-HZ 09, Phospholipase D1 Protein-Inc-HZ 09, Phospholipase D1 Protein- specificity protein 1 protein, specificity protein 1-IncHZ 09, In HZ 09- Homeobox protein MSX-1 protein, plotting Phospholipase D1 messenger ribonucleic acid-relative expression, ranging from 0.0 to 2.5 in increments of 0.5; Phospholipase D1 protein relative expression, ranging from 0 to 300 in increments of 100, Phospholipase D1 protein relative expression, ranging from 0 to 800 in increments of 200, specificity protein 1 protein relative expression, ranging from 0 to 200 in increments of 100, Homeobox protein MSX-1 protein relative expression, ranging from 0 to 250 in increments of 200 (y-axis) across Inc-HZ 09 relative expression, ranging from 0 to 4 in unit increments; Inc-HZ 09 relative expression, ranging from 0.5 to 2.5 in increments of 0.5; specificity protein 1 protein relative expression, ranging from 0 to 250 in increments of 50; Inc-HZ 09 relative expression, ranging from 0.5 to 2.5 in increments of 0.5, HZ 09 relative expression, ranging from 0.0 to 2.5 in increments of 0.5 (x-axis), respectively. Figure 5C is a set of two western blots. On the top, the western blot displays 124, 147, 89, 100, 163 under H C and 94, 36, 21, 92, 24 under R M (columns) and specificity protein 1, Phospholipase D1, Ras-related C3 botulinum toxin substrate 1, Cell division control protein 42 homolog, and Glyceraldehyde 3-phosphate dehydrogenase (rows). At the bottom, 73, 193, 96, 125, 159 under H C and 14, 19, 23, 148, 100 under P M (columns) and specificity protein 1, Phospholipase D1, Ras-related C3 botulinum toxin substrate 1, Cell division control protein 42 homolog, and Glyceraldehyde 3-phosphate dehydrogenase (rows). Figures 5H, 5L, 5O is a clustered bar graph, chromatin immunoprecipitation in tissues, chromatin immunoprecipitation in tissues, and methylated RNA immunoprecipitation sequencing in tissues, plotting Phospholipase D1 promoter relative fold enrichment, ranging from 0 to 4 in increment of 2; Inc-HZ 09 promoter relative fold enrichment, ranging from 0 to 6 in increment of 2, Inc-HZ 09 m(6)A methyltransferase relative fold enrichment, ranging from 0 to 9 in increments of 3 (y-axis) across anti-Immunoglobulin G and anti- specificity protein 1, anti-Immunoglobulin G and Homeobox protein MSX-1, and anti-Immunoglobulin G and anti-N6-Methyladenosine (x-axis) for H C and R M, respectively. Figure 5K is a set of two western blots. On the left, the western blot displays 196, 153, 108, 100, 93 under H C and 21, 46, 130, 31, 87 under R M (columns) and Human antigen R, Homeobox protein MSX-1, m(6)A methyltransferase and Glyceraldehyde 3-phosphate dehydrogenase (rows). On the right, 92, 100, 126, 131, 149 under H C and 74, 79, 43, 25, 98 under R M (columns) and Human antigen R, Homeobox protein MSX-1, m(6)A methyltransferase and Glyceraldehyde 3-phosphate dehydrogenase (rows).

Figures 5A, 5B, 5F, 5N are error bar graphs titled Inc-HZ 09, Phospholipase D1 messenger ribonucleic acid, specificity protein 1, m(6)A methyltransferase, plotting ribonucleic acid relative expression, ranging from 0 to 3 in unit increments, ribonucleic acid relative expression, ranging from 0 to 2 in unit increments, messenger ribonucleic acid relative expression, ranging from 0 to 2 in unit increments, and messenger ribonucleic acid relative expression, ranging from 0 to 10 in increments of 5 (y-axis) across H C and R M (x-axis), respectively. Figures 5D, 5E, 5G, 5I, 5M are graphs titled Phospholipase D1 messenger ribonucleic acid-Inc-HZ 09, Phospholipase D1 Protein-Inc-HZ 09, Phospholipase D1 Protein- specificity protein 1 protein, specificity protein 1-IncHZ 09, In HZ 09- Homeobox protein MSX-1 protein, plotting Phospholipase D1 messenger ribonucleic acid-relative expression, ranging from 0.0 to 2.5 in increments of 0.5; Phospholipase D1 protein relative expression, ranging from 0 to 300 in increments of 100, Phospholipase D1 protein relative expression, ranging from 0 to 800 in increments of 200, specificity protein 1 protein relative expression, ranging from 0 to 200 in increments of 100, Homeobox protein MSX-1 protein relative expression, ranging from 0 to 250 in increments of 200 (y-axis) across Inc-HZ 09 relative expression, ranging from 0 to 4 in unit increments; Inc-HZ 09 relative expression, ranging from 0.5 to 2.5 in increments of 0.5; specificity protein 1 protein relative expression, ranging from 0 to 250 in increments of 50; Inc-HZ 09 relative expression, ranging from 0.5 to 2.5 in increments of 0.5, HZ 09 relative expression, ranging from 0.0 to 2.5 in increments of 0.5 (x-axis), respectively. Figure 5C is a set of two western blots. On the top, the western blot displays 124, 147, 89, 100, 163 under H C and 94, 36, 21, 92, 24 under R M (columns) and specificity protein 1, Phospholipase D1, Ras-related C3 botulinum toxin substrate 1, Cell division control protein 42 homolog, and Glyceraldehyde 3-phosphate dehydrogenase (rows). At the bottom, 73, 193, 96, 125, 159 under H C and 14, 19, 23, 148, 100 under P M (columns) and specificity protein 1, Phospholipase D1, Ras-related C3 botulinum toxin substrate 1, Cell division control protein 42 homolog, and Glyceraldehyde 3-phosphate dehydrogenase (rows). Figures 5H, 5L, 5O is a clustered bar graph, chromatin immunoprecipitation in tissues, chromatin immunoprecipitation in tissues, and methylated RNA immunoprecipitation sequencing in tissues, plotting Phospholipase D1 promoter relative fold enrichment, ranging from 0 to 4 in increment of 2; Inc-HZ 09 promoter relative fold enrichment, ranging from 0 to 6 in increment of 2, Inc-HZ 09 m(6)A methyltransferase relative fold enrichment, ranging from 0 to 9 in increments of 3 (y-axis) across anti-Immunoglobulin G and anti- specificity protein 1, anti-Immunoglobulin G and Homeobox protein MSX-1, and anti-Immunoglobulin G and anti-N6-Methyladenosine (x-axis) for H C and R M, respectively. Figure 5K is a set of two western blots. On the left, the western blot displays 196, 153, 108, 100, 93 under H C and 21, 46, 130, 31, 87 under R M (columns) and Human antigen R, Homeobox protein MSX-1, m(6)A methyltransferase and Glyceraldehyde 3-phosphate dehydrogenase (rows). On the right, 92, 100, 126, 131, 149 under H C and 74, 79, 43, 25, 98 under R M (columns) and Human antigen R, Homeobox protein MSX-1, m(6)A methyltransferase and Glyceraldehyde 3-phosphate dehydrogenase (rows).

Regulation roles of lnc-HZ09 in human villous tissues. (A–B) RT-qPCR analysis of the levels of lnc-HZ09 (A) or PLD1 mRNA (B) in HC (healthy control, round) and RM (recurrent miscarriage, square) tissues (each n=15). (C) Western blot analysis of the protein levels of SP1, PLD1, RAC1, and CDC42 in HC and RM tissues (each n=10), with GAPDH as internal standard. The relative intensity of each band was quantified, and their levels were shown in Figure S10C. (D) The correlation between PLD1 mRNA levels and lnc-HZ09 levels in HC (round) and RM (square) tissues (each n=15). (E) The correlation between PLD1 protein levels and lnc-HZ09 levels in HC (round) and RM (square) groups (each n=10). (F) RT-qPCR analysis (each n=3) of the mRNA levels of SP1 in HC (round) and RM (square) tissues (each n=15). (G) The correlation between the protein levels of PLD1 and SP1 in HC (round) and RM (square) groups (each n=10). (H) SP1 ChIP assay analysis of the relative enrichment of SP1 in the promoter region of PLD1 gene in HC and RM tissues (each n=6). (I) The correlation between SP1 protein levels and lnc-HZ09 levels in HC (round) and RM (square) groups (each n=10). (J) RT-qPCR analysis of the mRNA levels of MSX1 in HC and RM tissues (each n=15). (K) Western blot analysis of the protein levels of HuR, MSX1, and METTL3 in HC and RM tissues (each n=10), with GAPDH as internal standard. The relative intensity of each band was quantified, and their levels were shown in Figure S10H,J,K. (L) MSX1 ChIP assay analysis of the relative enrichment of MSX1 in the promoter region of lnc-HZ09 in HC and RM tissues (each n=6). (M) The correlation between the levels of lnc-HZ09 and the protein levels of MSX1 in HC (round) and RM (square) groups (each n=10). (N) RT-qPCR analysis (each n=3) of the mRNA levels of METTL3 in HC and RM tissues (each n=15). (O) MeRIP assay analysis (each n=3) of the levels of m6A RNA methylation on lnc-HZ09 in HC and RM tissues (each n=6). The summary data of these bar charts and scatter plots were shown in Excel Table S1. The DNA or RNA level in IgG group was set as “1” in all of ChIP and MeRIP assays and the middle intensity value was set to “100” in all of western blot assays. (C–E, G, I, K, M) shows representative data from three independent experiments. Data in (H, L, O) show mean±SD of six independent experiments. Two-tailed Student’s t-test for (A–B,F,H,J,L,N–O); Pearson analysis for (D,E,G,I,M). *p<0.05, **p<0.01, and ***p<0.001. Note: ChIP, chromatin immunoprecipitation; GADPH; glyceraldehyde-3-phosphate dehydrogenase; HC, healthy control group; IgG, immunoglobulin G; MeRIP, methylated RNA immunoprecipitation; n, the number of biologically independent samples; ns, nonsignificance; PLD1, phospholipase D hydrolyze 1; RM, recurrent miscarriage group.