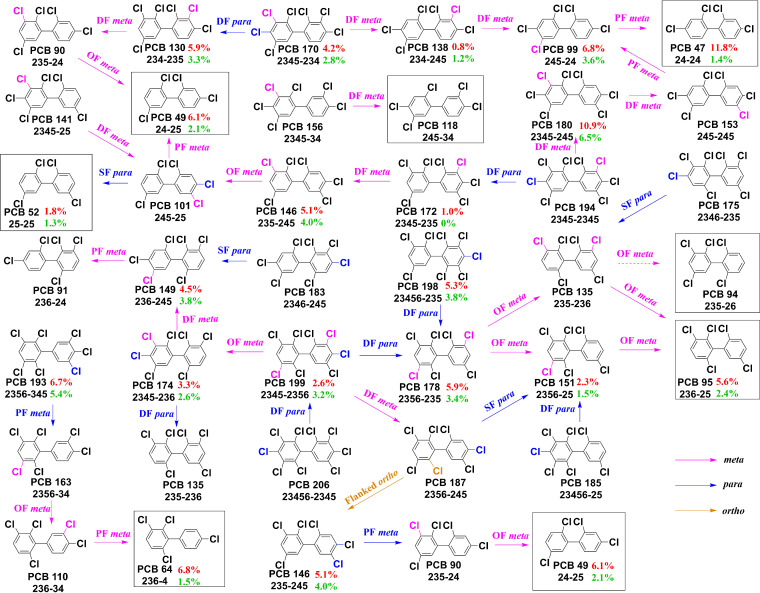
FIG 5.
Dechlorination pathways of Aroclor 1260. The dechlorination metabolites were detected based on gas chromatography-mass spectrometry analysis. Solid arrows indicate identified metabolites, and dashed arrows show proposed metabolites. The changes in the mol % of each PCB congener in TG4 and CG4 are shown in red and green, respectively. The dominant end products are boxed.

