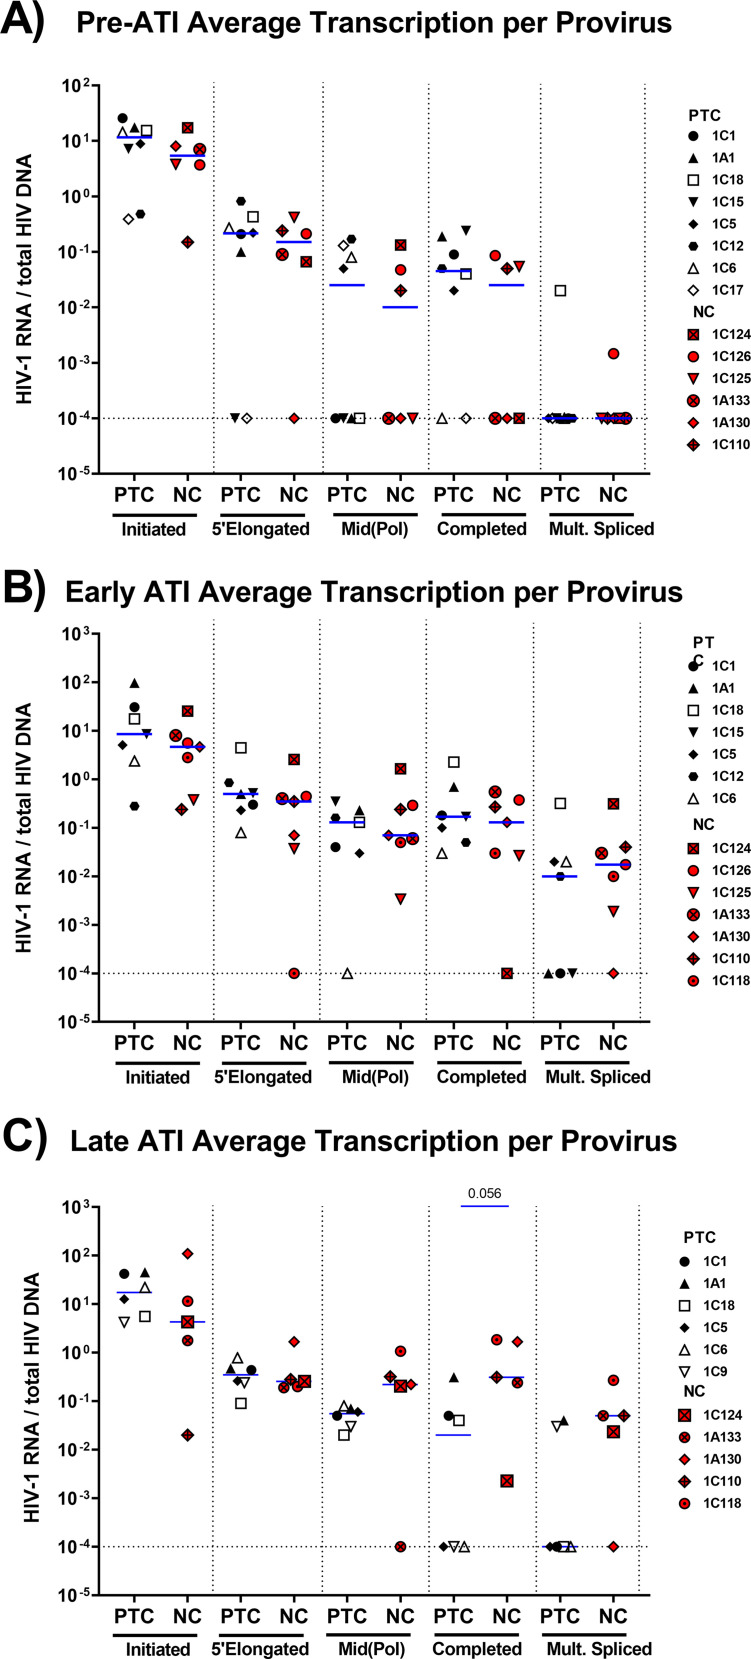
FIG 4.
Average HIV RNA levels per provirus do not differ between NCs and PTCs before ATI, but differences start to appear by late ATI. The average levels of each HIV transcript per provirus (HIV RNA/total HIV DNA) were compared between PTCs and NCs at pre-ATI (A), early ATI (B), and late ATI (C). Blue lines indicate medians. Ratios with a value of 0 were assigned a value of 0.0001. Statistics were calculated via the Mann-Whitney U test. Statistically trending data are denoted using blue bars, with the associated P values being above the data sets.

