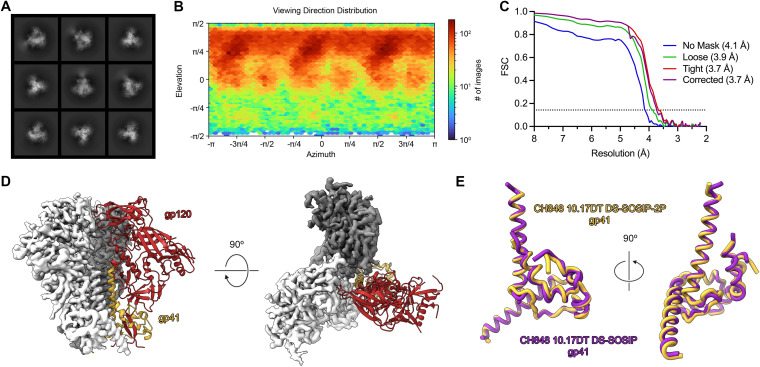
FIG 3.
The cryo-EM structure of CH848 10.17DT DS-SOSIP-2P. (A) Two-dimensional class averages of the CH848 10.17DT DS-SOSIP-2P Env ectodomain (calculated in cryoSPARC v3) are shown. (B) The viewing direction distribution plot (generated in cryoSPARC v3) is shown for the CH848 10.17DT DS-SOSIP-2P reconstruction. (C) Fourier shell correlation (FSC) curves for different masking strategies used by cryoSPARC v3 are plotted. The dotted line represents an FSC value of 0.143. (D) The 3.73-Å-resolution reconstruction is shown from side (left) and top (right) views. Two protomers are displayed as the cryo-EM map in either white or dark gray, and the third protomer is shown as a ribbon diagram of the corresponding model, with gp120 colored red and gp41 colored yellow. (E) A single monomer of gp41 from CH848 10.17DT DS-SOSIP-2P is shown in yellow and is aligned to a monomer of gp41 from a previously determined cryo-EM structure of CH848 10.17DT DS-SOSIP (PDB ID: 6UM7), colored purple.

