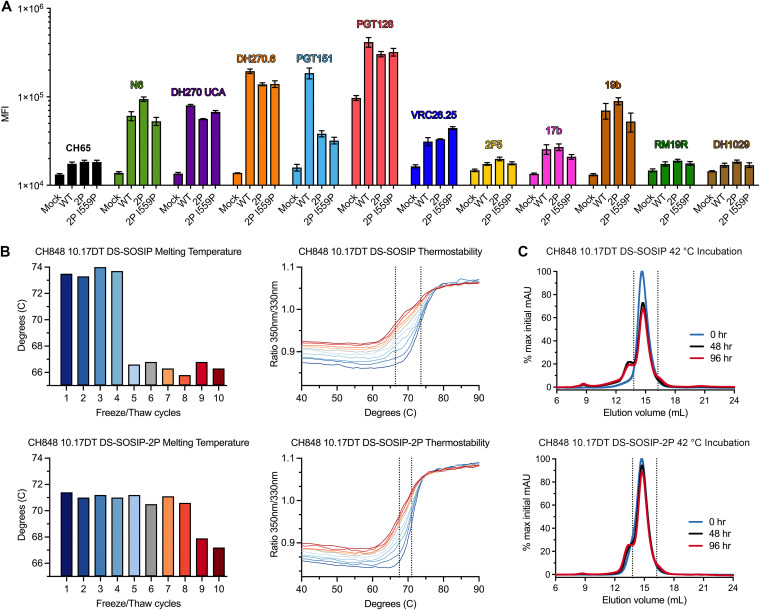
FIG 4.
Investigating the underlying mechanism of enhanced protein yield after proline stabilization. (A) Four cell populations were stained with a panel of Env-directed monoclonal antibodies. The average of three independent experiments is plotted ± standard error of mean. Each antibody has been assigned a color and is labeled above the corresponding bars; mock, untransfected; WT, CH848 10.17DT gp160; 2P, CH848 10.17DT 2P gp160; 2P I559P, CH848 10.17DT 2P I559P gp160; MFI, mean fluorescence intensity. (B) Top left, the CH848 10.17DT DS-SOSIP Tm is plotted for each round of freeze/thaw. Top right, DSF melting curves used to calculate CH848 10.17DT DS-SOSIP Tm are plotted and colored according to the bar graph on the left. The dotted line at 73.6°C represents the average Tm of rounds 1 to 4, and the dotted line at 66.4°C represents the average Tm for rounds 5 to 10. Bottom left, CH848 10.17DT DS-SOSIP-2P Tm is plotted for each round of freeze/thaw. Bottom right, DSF melting curves used to calculate CH848 10.17DT DS-SOSIP-2P Tm are plotted and colored according to the bar graph on the left. The dotted line at 71.0°C represents the average Tm of rounds 1 to 8, and the dotted line at 67.5°C represents the average Tm for rounds 9 to 10. (C) Top, size-exclusion chromatograms for three aliquots of CH848 10.17DT DS-SOSIP, incubated at 42°C for 0, 48, or 96 hr, are overlaid. The 0 hr sample is colored blue, the 48 hr sample is colored black, and the 96 hr sample is colored red. Data are plotted as a percentage of the maximum mAU value from the 0 hr sample. Bottom, size-exclusion chromatograms for three aliquots of CH848 10.17DT DS-SOSIP-2P, incubated at 42°C for 0, 48, or 96 hr, are overlaid. The 0 hr sample is colored blue, the 48 hr sample is colored black, and the 96 hr sample is colored red. Data are plotted as a percentage of the maximum mAU value from the 0 hr sample. Dashed lines at 13.80 and 16.25 mL correspond to area under the concentration time curve (AUC) measurements in Table S3 in the supplemental material.

