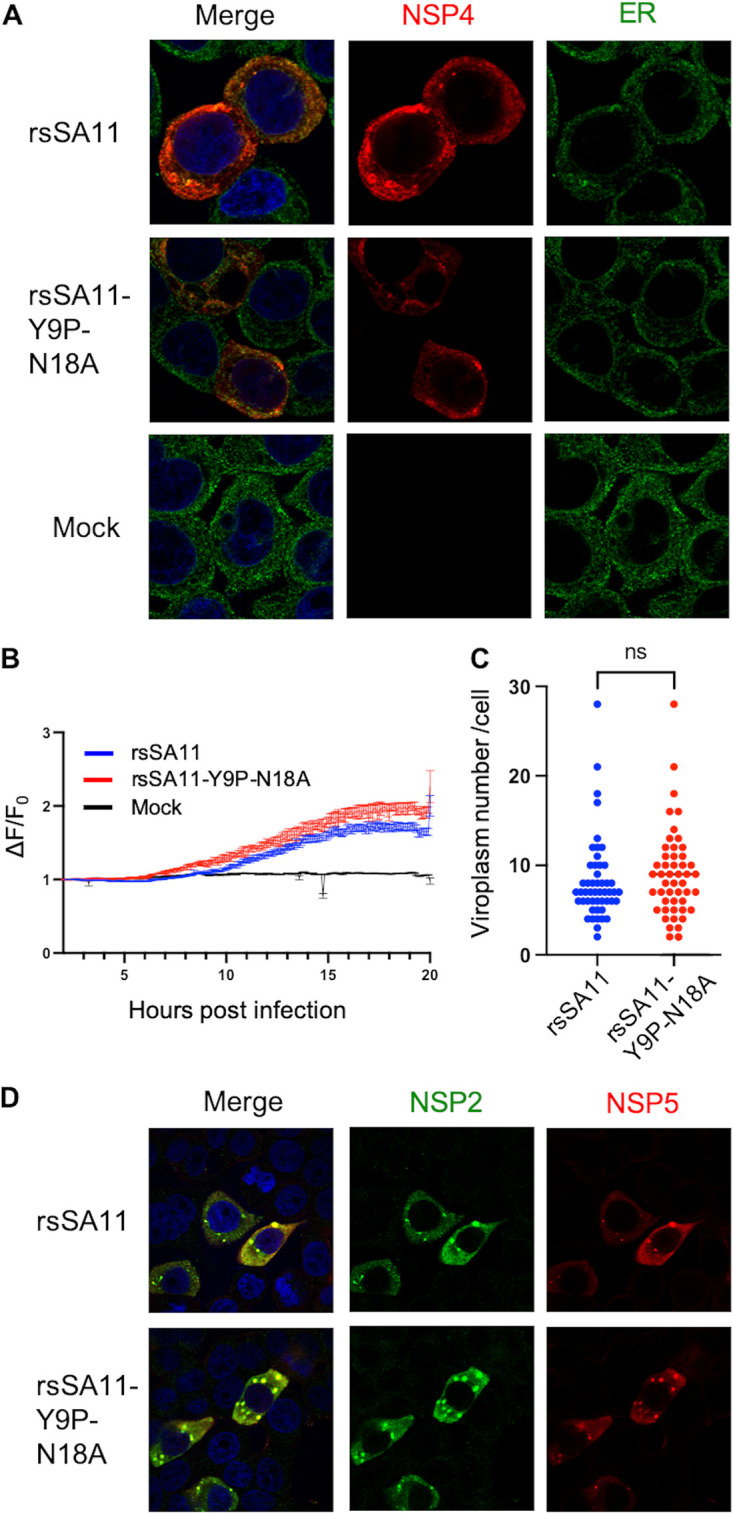
FIG 4.

N-glycosylation does not affect NSP4 localization, cytosolic Ca2+ elevation, or viroplasm formation in HT29 cells. (A) Colocalization of NSP4 and the ER. HT29 cells were infected with viruses at an MOI of 1. At 8 hpi, the cells were fixed and stained with anti-NSP4 and anti-ER antibodies. (B) Cytosolic Ca2+ kinetics. HT29 cells stably expressing GCaMP6s were infected with viruses at an MOI of 5. The fluorescence intensity was measured every 5 min at 37°C and 5% CO2. The Ca2+ kinetics are expressed as the relative fluorescence intensity compared to that at 2 hpi (ΔF/F0). (C and D) Viroplasm quantification and imaging. HT29 cells were infected with viruses at an MOI of 1. At 8 hpi, the cells were fixed and stained with anti-NSP2 and anti-NSP5 antibodies. Viroplasm numbers were counted manually under a confocal microscope. The dot-like structures stained by both anti-NSP2 and anti-NSP5 are regarded as viroplasm. Each dot represents the number of viroplasm in each infected cell (n = 50). Statistical differences were determined using the Mann-Whitney U test, with P < 0.05 considered significant (*, P < 0.05).
