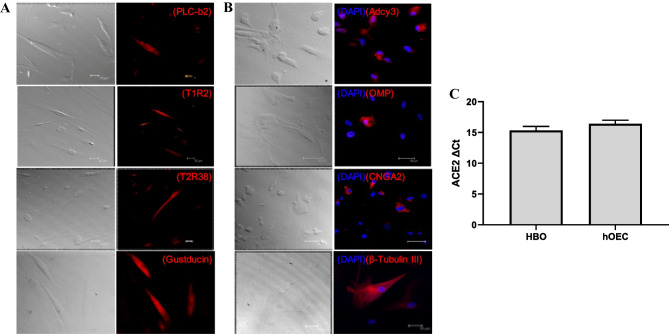
Fig. 1.
Immunostaining of HBO cells and hOECs. A, B Both HBO cells and hOECs showed presence of HBO cell-specific (PLC-b2, T1R2, T2R38, and gustducin, A) and hOEC-specific biomarkers (Adcy3, OMP, CNGA2, and b-tubulin III, B). Images were acquired with a Leica TCS-SP2 confocal laser scanning microscope. Transmission images of corresponding fields are shown on the left. Nuclei of cells were stained as blue with DAPI. For controls, immunostaining with antibody specific immunoglobulin demonstrated the absence of nonspecific immunoreactivity (data not shown). Scale bars = 25 μm. C mRNA level of ACE2 in HBO cells and hOECs was processed by RT-qPCR. Data are shown as delta Ct (ΔCt) values of ACE2 gene versus GAPDH gene

