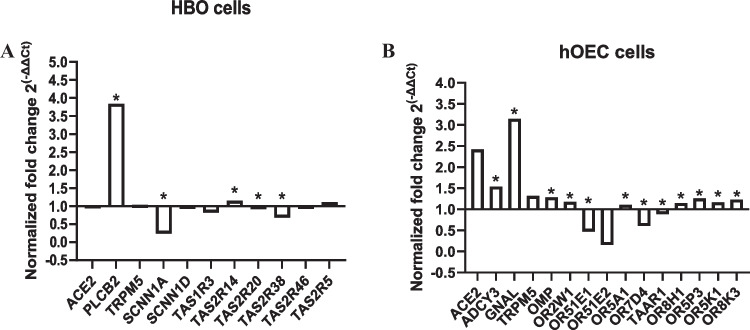
Fig. 4.
Relative quantification of taste and olfactory receptors mRNA expression measured by real-time [quantitative] PCR (RT-PCR) in SARS-CoV-2 infected vs. uninfected HBO cells (A) and hOECs (B). Normalization factors were calculated as the geometric mean of the expression levels of the GAPDH reference gene. Values are expressed as group mean; fold change 2−∆∆Ct vs. GAPDH gene, stars indicate a significant difference (p < 0.05) between infected (n = 3) and uninfected (n = 3) independent samples. SARS-CoV-2 infection of taste and olfactory cells resulted to changes of expression level of candidate receptors

