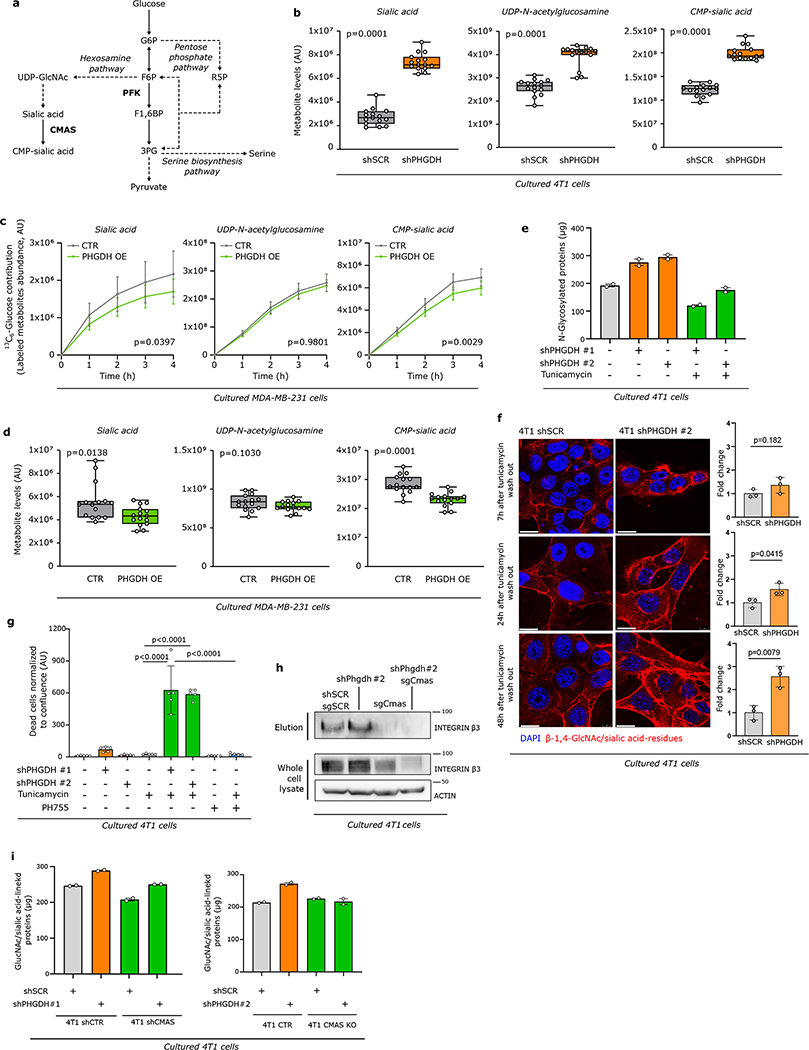
Extended Data Figure 6. Low PHGDH protein expression increases sialic acid metabolism and promotes glycosylation.
a. Schematic representation of glycolysis and its branching metabolic pathways. Enzymes are depicted in bold, pathway names in italics. Solid lines represent single reactions, dashed lines recapitulate multiple reactions.
b. Metabolite abundances of sialic acid, UDP-N-acetylglucosamine (UDP-GlcNAc) and CMP-sialic acid upon Phgdh knock-down in 4T1 cells (n=15). The solid lines indicate the median, the boxes extend to the 25th and 75th percentiles, the whiskers span the minimum and the maximum values. Unpaired t test with Welch’s correction, two-tailed.
c. Dynamic 13C6 glucose labeling of MDA-MB-231 cells showing 13C incorporation into sialic acid, UDP-N-acetylglucosamine and CMP-sialic acid upon PHGDH overexpression (PHGDH OE) (n=3). Error bars represent s.d. from mean. Two-way ANOVA.
d. Metabolite abundances of sialic acid, UDP-N-acetylglucosamine and CMP-sialic acid upon PHGDH overexpression (PHGDH OE) in MDA-MB-231 cells (n=15). The solid lines indicate the median, the boxes extend to the 25th and 75th percentiles, the whiskers span the smallest and the largest values. Unpaired t test with Welch’s correction, two-tailed.
e. Sialic acid/GlcNAc-containing-proteins isolated from whole cell lysate of 4T1 cells upon Phgdh knock-down (shPHGDH) or control (shSCR) cells treated with tunicamycin (0.05 μg/ml) or DMSO for 72h. Total isolated Sialic acid/GlcNAc-linked proteins were quantifying using Qubit™ Protein Assay Kit (n=2 independent experiments). Error bars represent s.d. from mean.
f. Levels of β-1,4-GlcNAc- and sialic acid-linked residues in 4T1 Phgdh knockdown (shPHGDH) and control (shSCR) cells after 72h of tunicamycin pretreatment (0.05 μg/ml) measured at 7, 24 and 48h after tunicamycin removal using wheat germ agglutinin (WGA) staining (n=3). Red, WGA β-1,4-GlcNAc- and sialic acid-linked proteins; blue, DAPI nuclear staining. Error bars represent standard deviation (s.d.) from mean. Unpaired t test with Welch’s correction, two-tailed. Scale bar 20 μm.
g. Cell viability upon tunicamycin (0.05 μg/ml) and PHGDH inhibitor (PH755, 1 μM) treatment (36h) in 4T1 cells upon Phgdh knock-down (shPHGDH) or control (shSCR) (n=5). Error bars represent s.d. from mean. One-way ANOVA with Turkey’s multiple comparison test.
h. Protein expression levels of glycosylated integrin β3 (elution) after WGA-mediated isolation of β-1,4-GlcNAc- and sialic acid-linked proteins from total lysates of 4T1 cells upon Phgdh knock-down (4T1 shPHGDH), Cmas knockout, and double Phgdh and Cmas gene inactivation, compared to control cells (4T1 shSCR). Total levels of integrin β3 from the whole cell lysate and actin as loading control are shown. Experiments were performed in triplicate, and one representative experiment is shown.
i. β-1,4-GlcNAc- and sialic acid-linked proteins isolated from whole cell lysate of 4T1 cells upon Phgdh and Cmas knockdown (shPHGDH, shCMAS), Cmas knockout (KO) or control (shSCR) cells treated with tunicamycin (0.05 μg/ml) or DMSO for 72h (n=2independent experiments). Error bars represent s.d. from mean.

