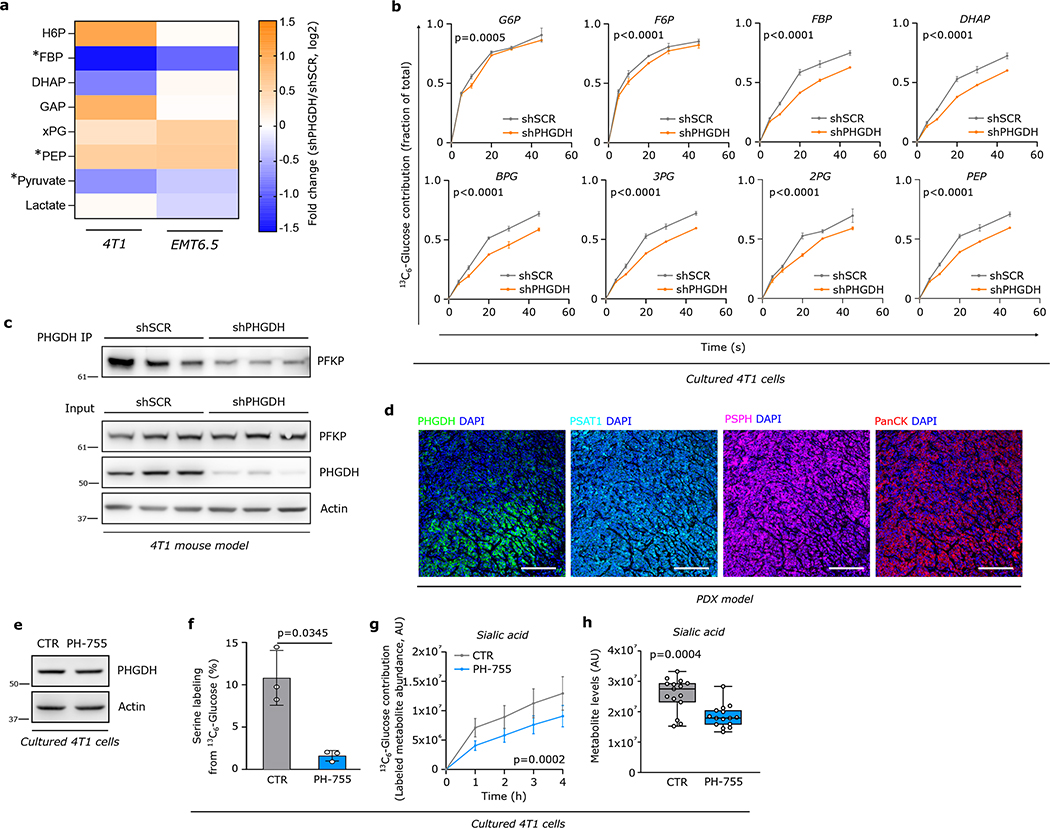
Extended Data Figure 8. Loss of PHGDH protein decreases PKF activity and increases carbon flux into the sialic acid pathway.
a. Changes in metabolite abundance upon Phgdh knockdown in 4T1 and EMT6.5 cells. Data represent fold changes compared to non-silenced cells (shSCR) (n=3). H6P, hexose-6-phosphate; FBP, fructose bisphosphate; DHAP, dihydroxyacetone phosphate; GAP, glyceraldehyde 3-phosphate; xPG, 2/3-phosphoglycerate; PEP, phosphoenolpyruvate. Unpaired t test two-tailed. *indicates statistically significant as follows: FBP, p=0.0042 (4T1), p=0.0012 (EMT6.5); PEP, p=0.0031 (4T1), p=0.034 (EMT6.5); Pyruvate, p=2.88e−11 (4T1).
b. Fractional contribution of 13C6-glucose to glycolytic intermediates in 4T1 upon Phgdh knockdown (shPHGDH) compared to control (shSCR) cells (n=3). Error bars represent s.d. from mean. Two-way ANOVA.
c. Interaction of PHGDH with PFKP in 4T1 control (shSCR) and Phgdh knockdown (shPHGDH) cells assessed by co-immunoprecipitation of PHGDH. A representative experiment is shown (n=3 independent experiments).
d. Protein expression levels of PHGDH, PSAT and PSPH in TNBC PDX model (BCM-3107-R2TG18) assessed by multiplex immunofluorescence. Green, PHGDH; Turquoise, PSAT; Pink, PSPH; red, pan-cytokeratin tumor marker; blue, DAPI nuclear staining. Scale bar 200 μm.
e. Protein expression levels of PHGDH upon treatment with the PHGDH catalytic inhibitor PH-775 (1 μM) for 72h. One representative experiment is shown (n=3).
f. Inhibition of de novo serine biosynthesis assessed through measurement of serine m+3 labeling after incubation of 4T1 cells for 24h in culture medium containing 13C6-glucose upon treatment with the PHGDH catalytic inhibitor PH-775 (1 μM) for 72h. Error bars represent s.d. from mean. Unpaired t test with Welch’s correction, two-tailed.
g. Dynamic labeling using 13C6-glucose of 4T1 cells showing 13C incorporation into sialic acid upon treatment with the PHGDH catalytic inhibitor PH-775 (1 μM) for 72h (n=3). Error bars represent s.d. from mean. Two-way ANOVA.
h. Metabolite abundance of sialic acid upon treatment with the PHGDH catalytic inhibitor PH-775 (1 μM) for 72h in 4T1 cells. The solid lines indicate the median, the boxes extend to the 25th and 75th percentiles, the whiskers span the smallest and the largest values (n=15). Unpaired t test with Welch’s correction, two-tailed.
G6P, glucose-6-phosphate; F6P, fructose-6-phosphate; H6P, hexose-6-phosphate; FBP, fructose bisphosphate; DHAP, dihydroxyacetone phosphate; xPG, 2/3-phosphoglycerate; PEP, phosphoenolpyruvate.

