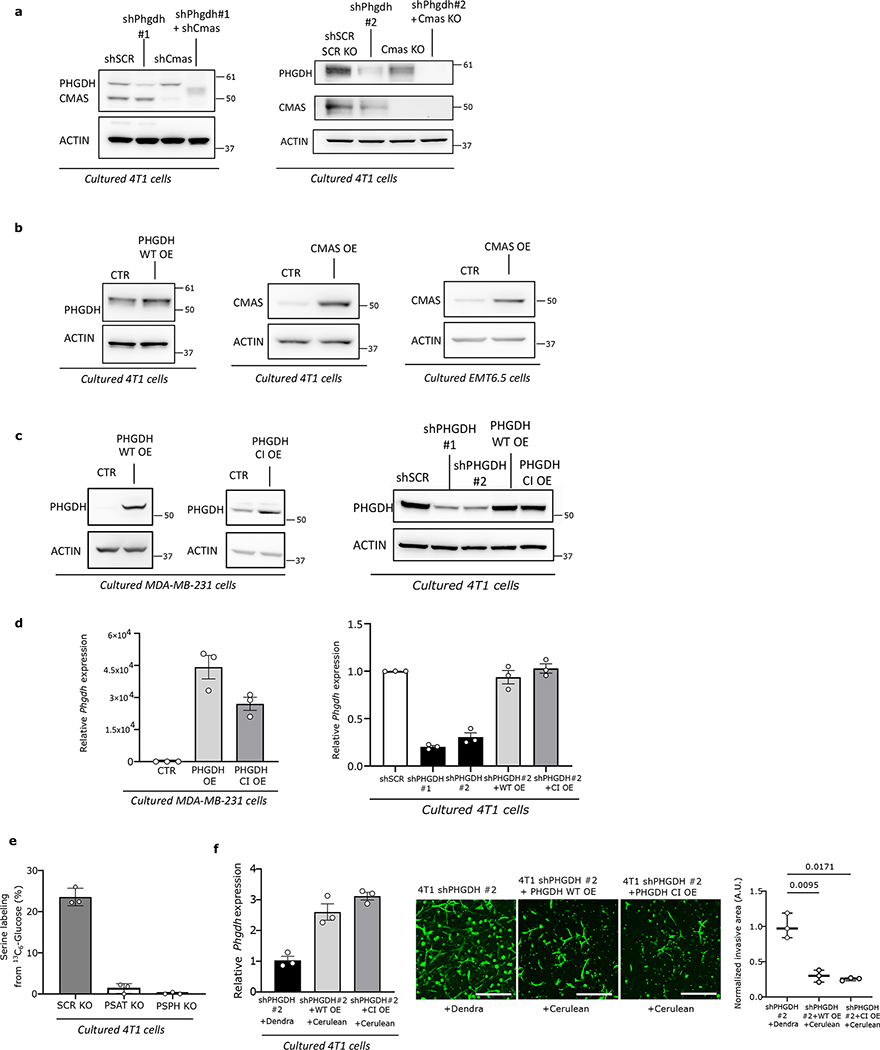
Extended Data Figure 10. Validation of genetic modification of breast cancer cells.
a. Protein expression levels of PHGDH and CMAS in 4T1 cells used in Figures 2e, 3a, 3b, 3c, 3d, and Extended Data Figures 3j, 3l, 4a, 4b, 4c, 4d, 4e, 4h, 5a, 5b, 5e, 6b, 6e, 6f, 6g, 6h, 6i, 7a, 7b, 7d, 7f, 8b, 8c and 9e.
b. Protein expression levels of PHGDH and CMAS in 4T1 and EMT6.5 cells used in Extended Data Figure Figures 2j, 4c
c. Protein expression levels of PHGDH in MDA-MB-231 and 4T1 cells used in Figures 4c, 4c and Extended Data Figures 4f, 4j,6c, 6d, 9a–f and 9i.
d. Relative Phgdh expression in MDA-MB-231 and 4T1 cells detailed in c (n=3 independent samples). Error bars represent standard deviation (s.d.) from mean.
e. Psat and Psph gene inactivation measured by a decrease in 13C6-Glucose incorporation into serine in 4T1 cells used in Extended Data Figure 9g (n=3 independent samples). Error bars represent standard deviation (s.d.) from mean.
f. Relative Phgdh expression and invasion ability in 4T1 cells used in Figures 2a, 2b, 4c, and Extended Data Figures 3h, 3i and 9i (n=3independent samples). Error bars represent standard deviation (s.d.) from mean.

