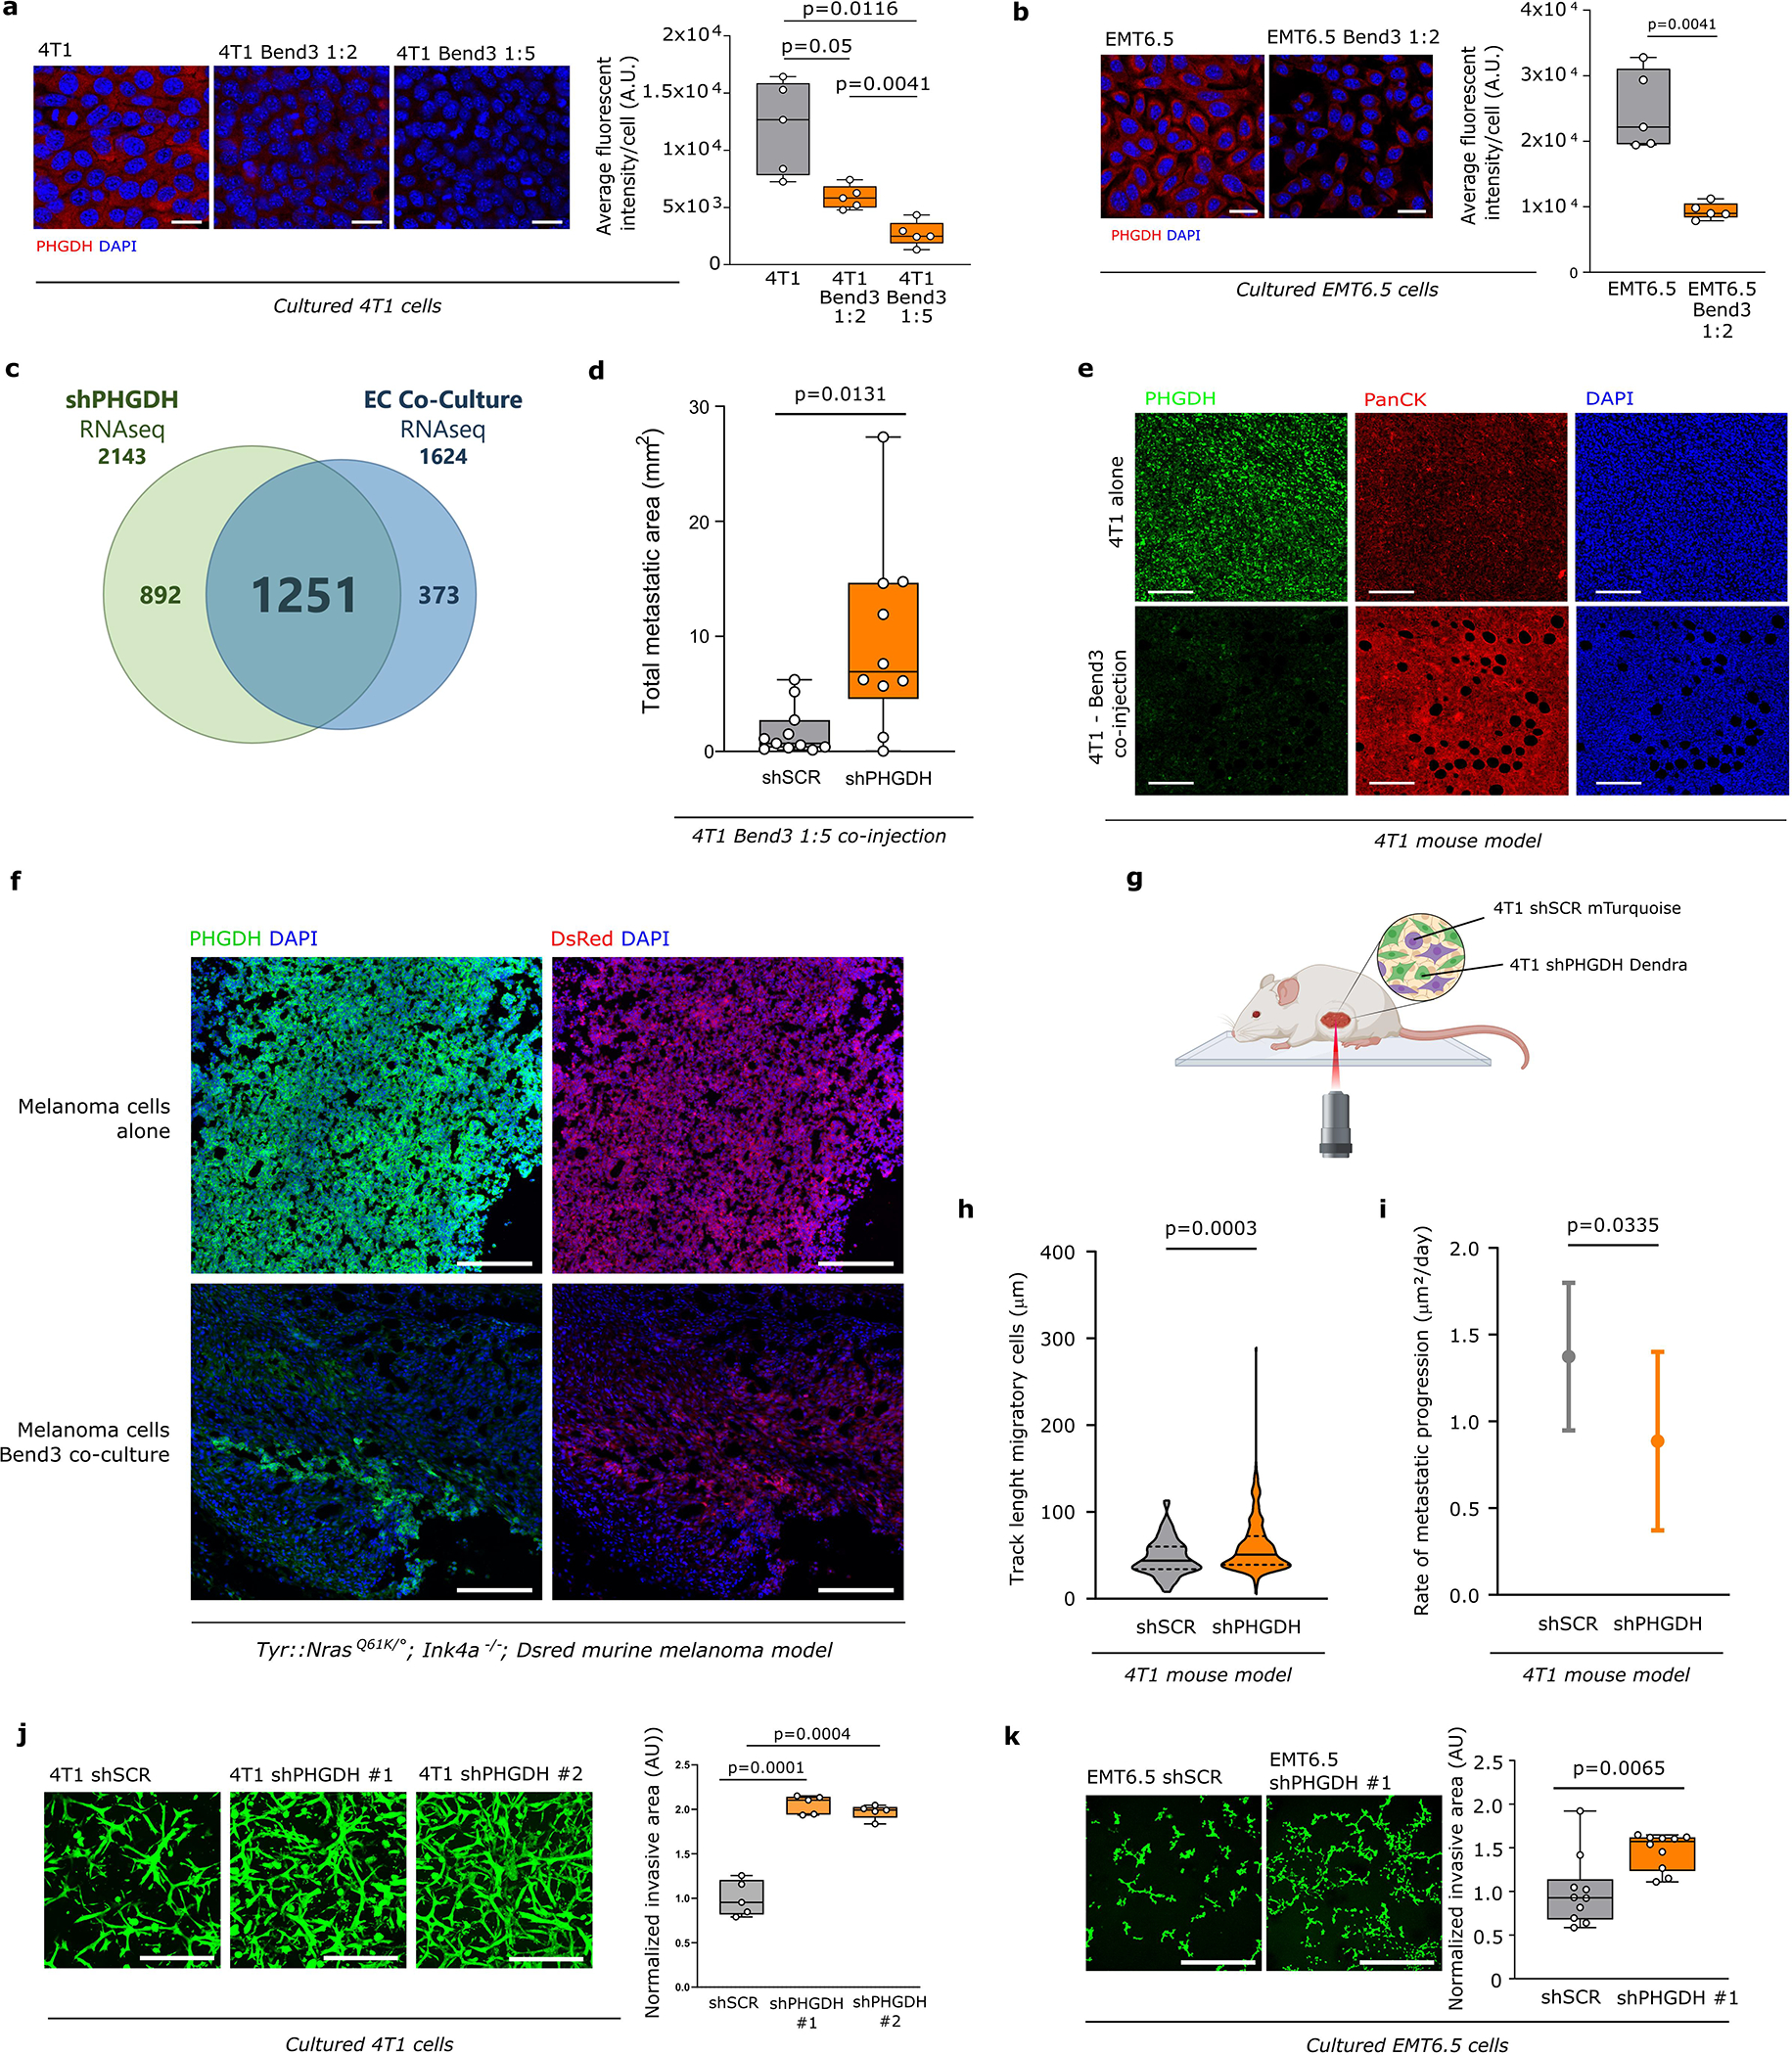
Extended Data Figure 3. Proximity to endothelial cells induces loss of PHGDH in cancer cells.

a-b. PHGDH expression in 4T1 (1:2 and 1:5 ratio) and EMT6.5 cells (1:2 ratio) co-cultured with Bend3 immortalized mouse endothelial cells based on immunofluorescence. Left panel, representative pictures (scale bar 50 μm), red, PHGDH; blue, DAPI nuclear staining. The image represented was selected to show only 4T1/EMT6.5 cells based on pan-cytokeratin expression in cancer cells and GFP expression in Bend3 cells. Right panel, fluorescent intensity quantification (n=4 independent samples). Solid lines indicate the median, the boxes extend to the 25th and 75th percentiles, the whiskers span the minimum and maximum values. Welch and Brown-Forsythe ANOVA with Dunnett’s multiple comparison (a) and unpaired t test with Welch’s correction, two-tailed (b).
c. Venn diagram depicting the number of overlapping enriched gene sets, based on Gene Set Enrichment Analysis (GSEA) in RNAseq data from 4T1 Phgdh knock-down (shPHGDH) compared to control cells (left), versus enriched gene sets in 4T1 and EMT6.5 cells co-cultured (1:2 ratio) with Bend3 immortalized mouse endothelial cells (EC Co-Culture) compared to mono-cultured 4T1 or EMT6.5 cells (right). The numbers at the top represent the total enriched gene-sets found in the corresponding data set.
d. Lung metastatic area in mice co-injected with 4T1 cancer cells and Bend3 endothelial cells (ratio 1:2) or 4T1 cells alone in the mammary fat pad (n≥10). The solid lines indicate the median, the boxes extend to the 25th and 75th percentiles, the whiskers span the minimum and maximum values. Unpaired t test with Welch’s correction, two-tailed.
e. PHGDH protein expression in 4T1 primary tumor of mice injected with cancer cells alone or co-injected with Bend3 immortalized mouse endothelial cells assessed by immunohistochemistry. Green, Phgdh; red, pan-cytokeratin tumor marker; blue, DAPI nuclear staining. Scale bar 200 μm.
f. Representative pictures of PHGDH protein expression in primary melanoma model (Tyr::N-Ras+/Q61K;Ink4a−/−) from mice injected with melanoma cells alone or co-injected with melanoma and Bend 3 endothelial cells (ratio 1:2). Green, PHGDH; red, dsRed tumor cell marker; blue, DAPI nuclear staining. Scale bar 200 μm.
g. Schematic representation of the time-lapse intravital imaging experiment setup.
h. Track length of migratory 4T1 shSCR-mTurquoise and 4T1 shPHGDH-Dendra in primary tumors from orthotopic (m.f.p.) 4T1 mouse model assessed by time-lapse intravital imaging. The solid lines indicate the median, the dashed lines indicate the 25th and 75th percentiles. Unpaired t test with Welch’s correction, two-tailed.
i. Rate of metastatic progression of lung metastases from mice injected with either 4T1 shSCR (n=10 per time point) or 4T1 shPHGDH cells (n=10 per time point). Error bars represent standard deviation (s.d.) from mean. Unpaired t test with Welch’s correction, two-tailed.
j-k. Invasive capacity of 4T1 and EMT6.5 cells upon Phgdh knock-down (shPHGDH) compared to control (shSCR) cells in a 3D matrix. Invasion was assessed by measuring the invasive area of cancer cells stained with calcein green. Representative images are depicted in the left panel (scale bar 500 μm), quantification in the right panel. Each dot represents a different, randomly selected microscopy field (n=5 for (j), n=10 for (k)). The solid lines indicate the median, the boxes extend to the 25th and 75th percentiles, the whiskers span the minimum and maximum values. Welch and Brown-Forsythe ANOVA with Dunnett’s multiple comparison (j) and Unpaired t test with Welch’s correction, two-tailed (k).
