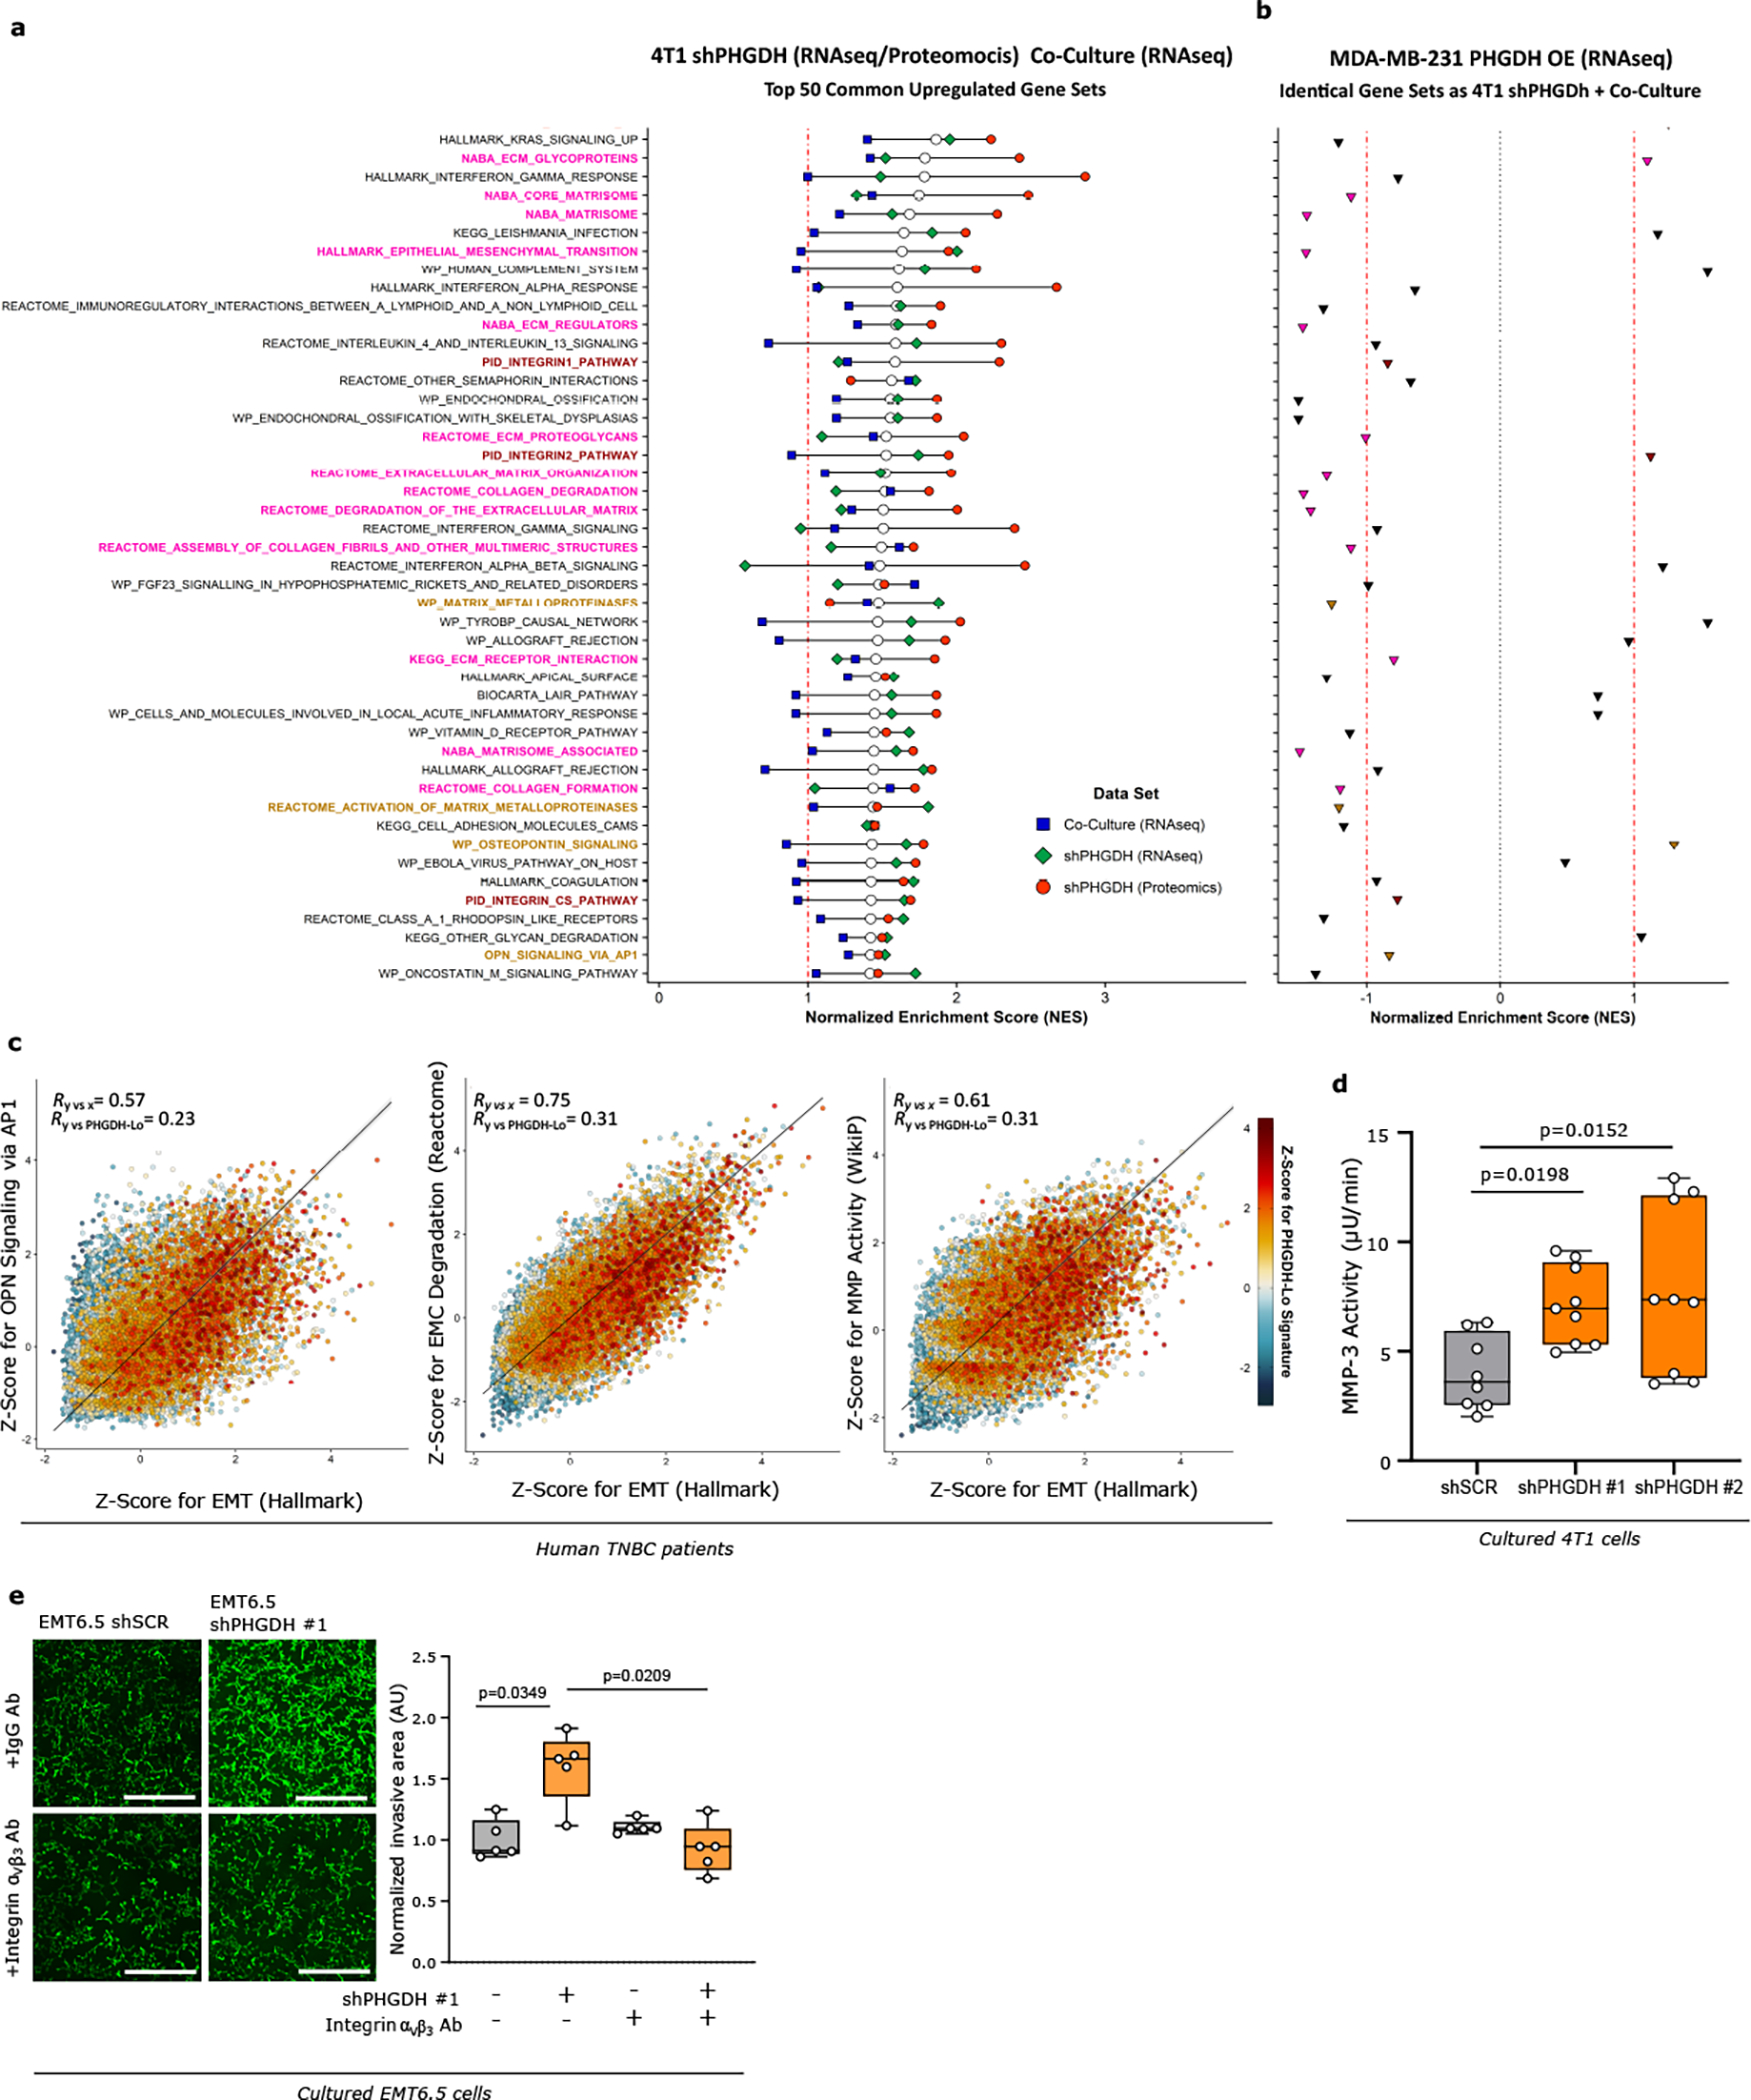
Extended Data Figure 5. Modulation of PHDGH expression alters gene expression signatures related to metastasis formation.

a. GSEA showing the top 50 commonly upregulated gene sets upon integration of the RNAseq/Proteomics data sets for 4T1 cells upon Phgdh knockdown (shPHGDH) compared to control cells, and the RNAseq data set for 4T1 or EMT6.5 cells co-cultured with Bend 3 immortalized mouse endothelial cells, compared to mono-cultured 4T1 or EMT6.5 cells. Normalized enrichment scores (NES) for each data set are indicated by the colored symbols, as defined in the plot legend. Gene sets are ranked based on their average NES among all three data sets, indicated by the white dots, with those gene sets with the highest mean NES shown on top. The red dash-dotted line indicates a NES of 1. The gene-set entries on the y-axis include three single-sample signatures comprising the most differentially upregulated genes in each of the three data sets (color-coded identically to the plot legend), as well as a signature consisting in the intersection of those for the Phgdh knockdown and co-culture RNAseq data (color-coded in orange), indicative of low Phgdh protein expression. The remaining entries on the y-axis are color-coded based on their belonging to one of the following categories: EMT and ECM remodeling (pink), integrin signaling (burgundy), OPN/AP-1 signaling and MMP activity (light brown), or other (black).
b. GSEA results based on RNAseq data for MDA-MB-231 cells upon PHGDH overexpression (PHGDH OE) compared to control cells for the identical gene sets as in a. The red dash-dotted lines indicate a NES of ±1, whereas the black dotted line indicates a NES of 0. Data points are color-coded according to the same color scheme used for the respective gene-set entries in a.
c. Correlation plots of GSVA-derived Z-scores for 3 of the top 50 hits found upon integration of the RNAseq/Proteomics/Co-Culture data sets (see Extended Figure 5a) versus the scores for the Hallmark EMT gene signature (on the x-axis). Data were obtained from RNAseq of scRNA-seq data for primary tumors of 13 TNBC patients. The color code indicates the Z-Score for a gene expression signature indicative of low PHGDH protein expression. Total least-squares regression lines and confidence intervals are overlaid on top of each plot, with the corresponding Pearson correlation coefficient (R) values shown on the top-left corners.
d. Activity of extracellularly secreted MMP-3 (μU/min) in cell culture media collected from invasion assays of 4T1 cells upon Phgdh knockdown (shPHGDH) or control (shSCR) cells after 72h of seeding (n=3 independent experiments). The solid lines indicate the median, the boxes extend to the 25th and 75th percentiles, the whiskers span the minimum and maximum values. One-way ANOVA with Dunn’s multiple comparison.
e. Invasive capacity of EMT6.5 cells pre-treated (24h) with an antibody against integrin αvβ3 or control IgG (2.5 μg/ml) and upon Phgdh knockdown (shPHGDH) compared to control (shSCR) cells in a 3D matrix. The invasive area was stained with calcein green. Each dot represents a different microscopy field (n=5). The solid lines indicate the median, the boxes extend to the 25th and 75th percentiles, the whiskers span the minimum and maximum values. Welch and Brown-Forsythe ANOVA with Dunnett’s multiple comparison.
