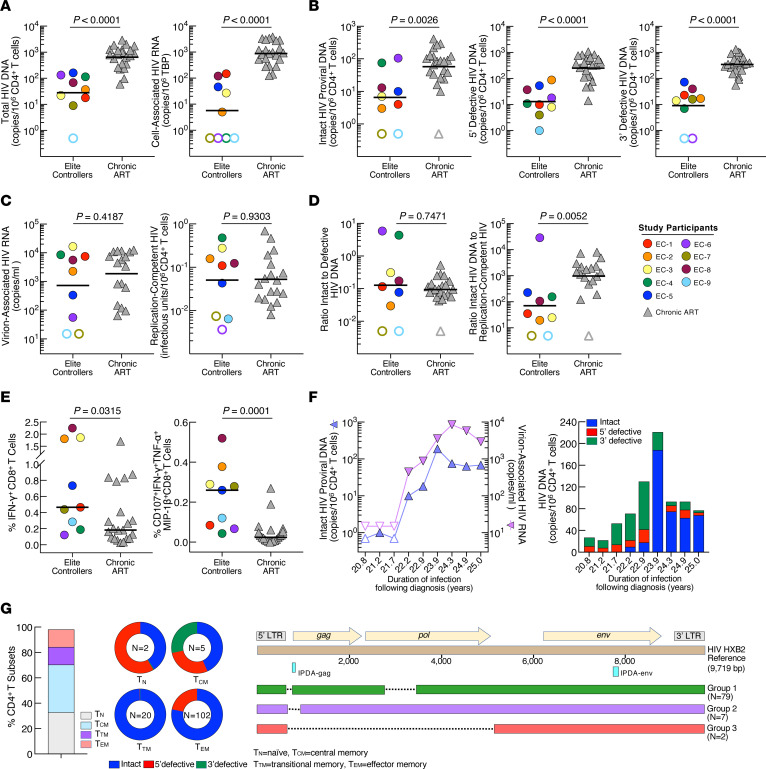
Figure 1. HIV reservoirs and immune responses.
(A) Total HIV DNA and cell-associated HIV RNA, TBP, TATA-binding protein, (B) intact proviral and defective DNA, (C) virion-associated HIV RNA and replication-competent virus, (D) ratios of intact-to-defective and intact proviral DNA to replication-competent virus, and (E) HIV-specific immune responses between the EC and CA groups. Open symbols indicate values under limits of detection. Black bars represent the geometric mean or median values. P values were determined using the Mann-Whitney test and were not adjusted. (F) Measurements of intact proviral DNA and inducible virion-associated HIV RNA as well as composition of intact and defective HIV DNA in EC-4. (G) Percentage of CD4+ T cell subsets and distribution of intact and defective HIV DNA within each subset in EC-6. n = total DNA copy numbers/106 CD4+ T cells. Sequence alignment of HIV DNA is shown.

