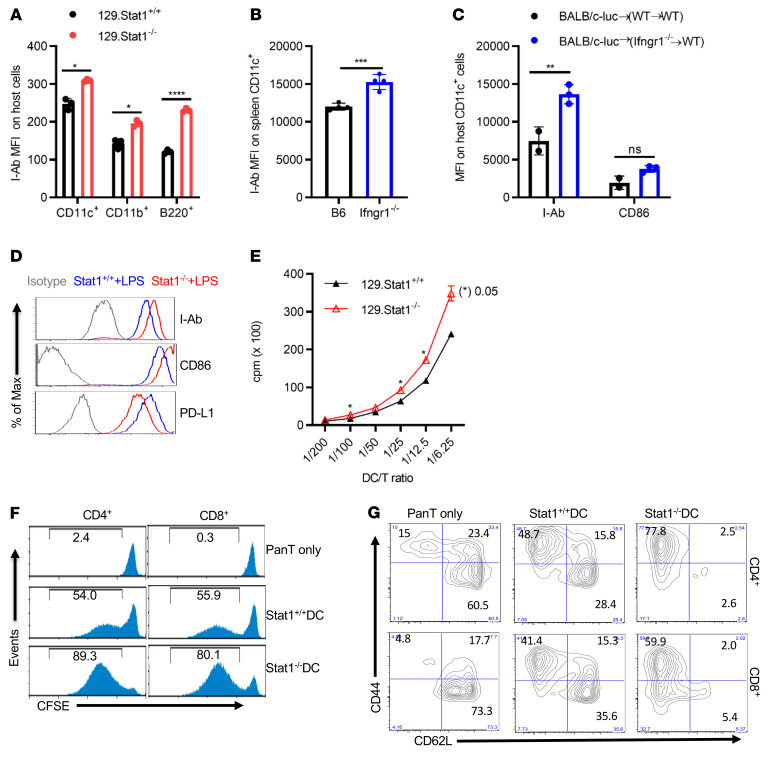
Figure 3. Absence of IFN-γR/STAT1 promotes an allostimulatory capacity in DCs.
(A) On day 1 after BMT, different APC populations from recipient animals were analyzed following induction of GVHD using a fully MHC-mismatched [BALB/c (H2d) to 129Sv (H2b)] strain combination. MHC II expression on recipient splenic H2b+ CD11c+, CD11b+, and B220+ cells from recipient 129.Stat1+/+ and 129. Stat1–/– animals. Results from 1 representative experiment of 3 are shown, with 3 animals/group. (B) GVHD was induced in the fully MHC-mismatched BALB/c (H2d) to B6 (H2b) strain combination in B6 WT or B6.Ifngr1–/– mice. I-Ab expression on recipient splenic CD11c+ cells was studied on day 1 after BMT. Results from 1 representative experiment of 2 are shown with 3–4 animals/group. (C) I-Ab and CD86 expression on CD11c+ cells from Ifngr1–/–→B6.SJL chimeric recipients were compared with expression on cells from the B6→B6.SJL counterparts 2 days after the second transplantation of BALB/c TCD BMCs and BALB/c-Luc splenocytes. Results from 1 representative experiment of 2 are shown, with 2–3 animals per group. (D) Expression of I-Ab, CD86, and PD-L1 in CD11c+ BMDCs from Stat1+/+ or Stat1–/– mice. Cells were cultured in RPMI 1640 medium containing 10% FCS and GM-CSF (20 ng/mL) for 6 days and matured in 100 ng/mL LPS for an additional 48 hours. Results from 1 representative experiment of more than 3 independent experiments are shown. (E–G) Proliferation and activation of CFSE-labeled alloreactive pan–T cells isolated from BALB/c splenocytes stimulated with LPS-matured Stat1+/+ or Stat1–/– BMDCs. Freshly isolated pan–T cells from BALB/c mice cells were stimulated for 5 days with LPS-matured Stat1+/+ or Stat1–/– BMDCs at a DC/responder ratio of 1:5. The proliferation of responder cells was assessed by 3H-incorporation, presented as the cpm ratio compared with unstimulated responder cells (E), or by CFSE dilution, presented as the percentage of CFSElo population (F). T cell activation was measured by CD44 and CD62L expression in responder CD4+ or CD8+ T cells (G). Results from 1 representative experiment of 3 independent experiments are shown. Bar graphs represent the mean ± SEM. *P < 0.05, **P < 0.01, ***P < 0.001, and ****P < 0.0001, by 2-way ANOVA with Šidák’s correction.

