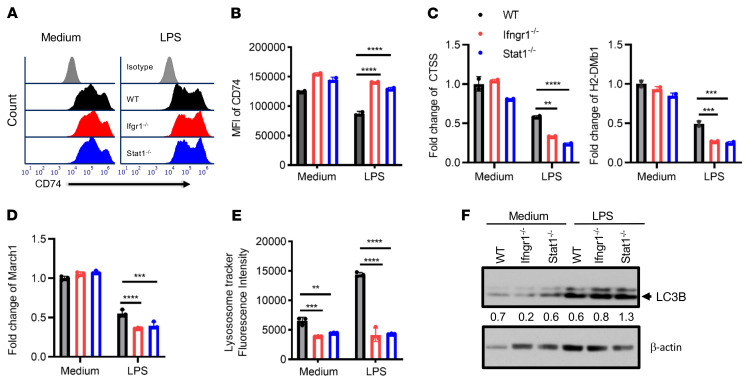
Figure 6. BMDCs with IFN-γR/STAT1 deficiency exhibit impaired peptide exchange and reduced turnover of surface MHC II upon LPS maturation.
(A and B) CD74 expression on CD11c+ BMDCs from B6 WT (black), B6.Ifngr1–/– (red), and Stat1–/– (blue) mice after LPS maturation for 48 hours (gray histogram represents the isotype control). (C and D) Real-time quantitative PCR analysis of Ctss, H2-DMb1, and March1 mRNA expression in CD11c+ BMDCs incubated in the presence or absence of LPS for 4 hours. (E) Flow cytometric quantitation of LysoTracker staining of immature or LPS-matured BMDCs from WT, Ifngr1–/–, or Stat1–/– mice. (F) LC3B expression in WT, Ifngr1–/– and Stat1–/– BMDCs after 48 hours of LPS maturation was assessed by Western blotting, semiquantified by ImageJ (NIH). Bar graphs represent the mean ± SEM. **P < 0.01, ***P < 0.001, and ****P < 0.0001, by 2-way ANOVA and Dunnett’s correction for multiple comparisons versus the WT control.

