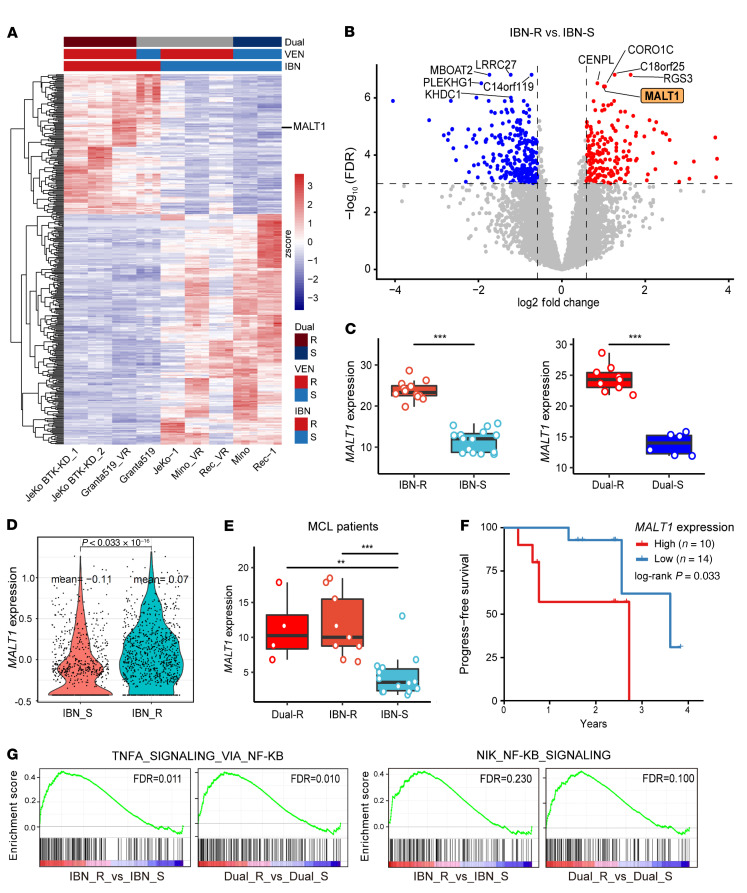
Figure 1. MALT1 is overexpressed in ibrutinib-resistant MCL cell lines and primary MCL cells.
(A) Heatmap with MALT1 highlighted in the right as one of the top DEGs in IBN-R MCL cells compared with IBN-S cells. (B) Volcano plot shows MALT1 was upregulated in the IBN-R group. (C) MALT1 mRNA expression in IBN-R versus IBN-S and Dual-R versus Dual-S groups. (D) Violin plot shows MALT1 mRNA expression in IBN-R (n = 17) versus IBN-S (n = 4) MCL cells at single-cell resolution determined by single-cell RNA sequencing. Statistical significance was calculated using Wilcoxon’s rank-sum test. (E) MALT1 mRNA expression determined by qPCR in IBN-R (n = 9), Dual-R (n = 4), and IBN-S (n = 13) cells. Statistical significance was determined based on the adjusted P values using Dunnett’s approach. **P < 0.01; ***P < 0.001. (F) High MALT1 mRNA expression correlated with progress-free survival in MCL patients. The log-rank test was used to assess the statistical significance of progression-free survival. (G) GSEA identifies NF-κB signaling pathways as top cancer hallmarks that were upregulated in IBN-R cells compared with IBN-S cells. FDRs were generated using the Benjamini-Hochberg method. Box-and-whisker plots in C and E show the median ± 1 quartile, with whiskers extending from the hinge to the smallest and largest values within 1.5 × (interquartile range) from the box boundaries. The values beyond the ends of the whiskers are outliers. All other data represent the mean ± SD.

