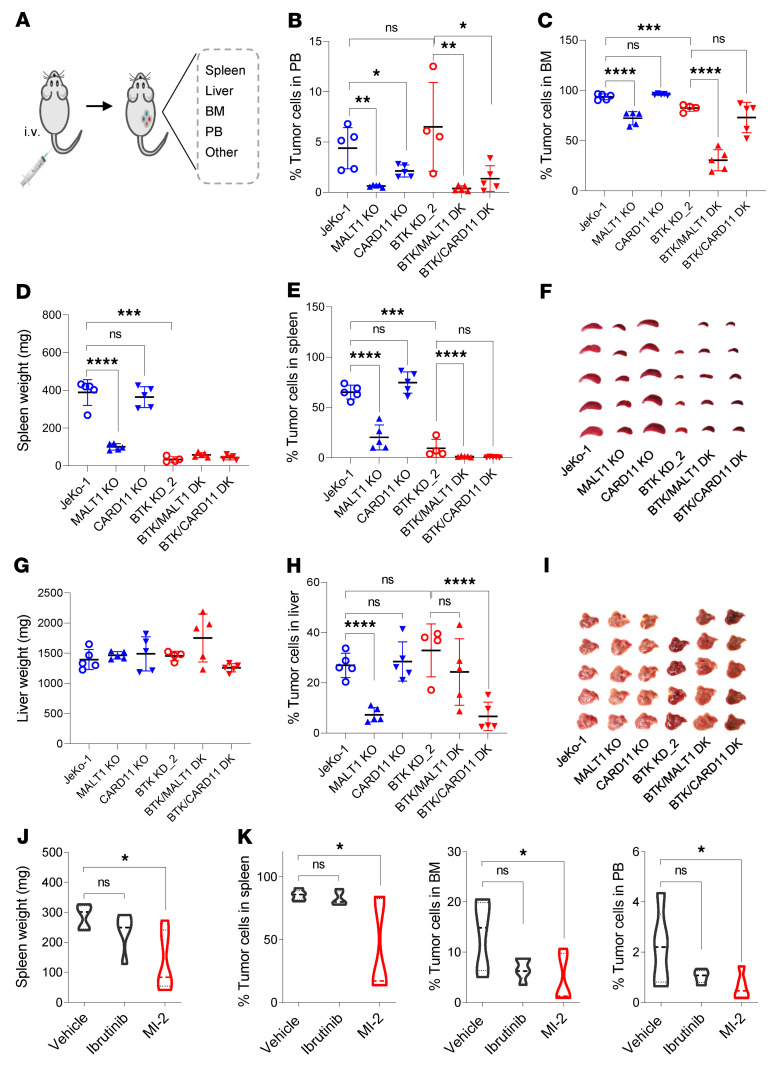
Figure 5. MALT1, but not CARD11, is critical for MCL cell dissemination to mouse spleen, liver, and BM.
(A) Schematic illustration of disseminated cell line–derived CDX or PDX models. (B–I) Disseminated CDX models were established using JeKo-1 and JeKo BTK KD-2 cells, with or without MALT1 or CARD11 KO (n = 5 per group). At the end of the experiment, the spleen, liver, BM, and PB were harvested, imaged (F and I), and weighed (D and G) if appropriate. The tumor cell percentages in PB (B), BM (C), spleen (E), and liver (H) were determined by flow cytometry. The CD5+CD20+ cells represent tumor cell populations. (J and K) Freshly isolated primary PDX cells were injected intravenously into NSG mice to establish disseminated PDX models (n = 5 per group). At 6 weeks after injection, the mice were treated with vehicle, ibrutinib (50 mg/kg), or MI-2 (25 mg/kg) daily for 4 weeks. At the end of the experiment, mouse spleens were weighed (J). The CD5+CD20+ MCL cells were measured in spleens (K, left panel), BM (K, middle panel), and PB (K, right panel). One-way ANOVA was used in B–E, H, J, and K, where statistical significance was determined based on the adjusted P values using Šídák’s method. Data represent mean ± SD. *P < 0.05; **P < 0.01; ***P < 0.001; ****P < 0.0001.

