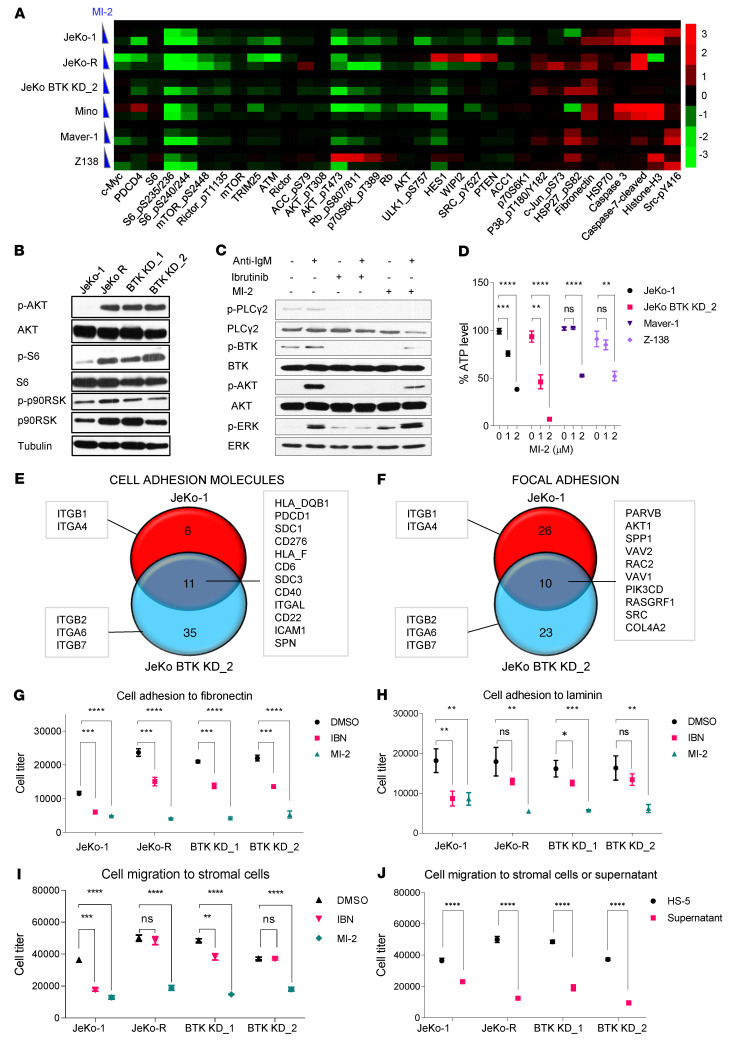
Figure 6. MALT1 inhibition leads to suppressed PI3K/AKT/mTOR signaling, cell adhesion, and migration in vitro.
(A) RPPA analysis for MCL cell lines treated with MI-2 at 0, 1, or 2 μM for 6 hours. The heatmap shows the protein expression altered by MI-2 treatment. Each treatment for the indicated cell lines was set up in triplicate. (B) Phosphorylation of AKT, S6, and p90RSK was upregulated in JeKo-R and JeKo BTK KD-1 and -2 cells. (C) The phosphorylation of PLCγ2, BTK, AKT, and ERK was reduced upon MI-2 pretreatment followed by IgM stimulation in JeKo-1 cells. (D) ATP production was suppressed upon MI-2 treatment in MCL cells. Error bars were generated from 3 independent replicates. (E and F) The common DEGs involved in cell adhesion molecules and focal junction downregulated upon MI-2 treatment in both JeKo-1 (E) and JeKo BTK KD-2 (F) cells. Various integrin molecules altered upon MI-2 treatment are also indicated. (G and H) MCL cells were pretreated with DMSO, IBN at 5 μM, or MI-2 at 0.5 μM for 30 minutes and incubated in plates precoated with fibronectin (G) or laminin (H) for 4 hours. The cells adherent to fibronectin or laminin were measured and plotted. (I) MCL cells were pretreated with DMSO, IBN at 5 μM, or MI-2 at 1 μM for 30 minutes, added to Transwell inserts, and incubated in plates preseeded with a monolayer of stromal cells (HS-5) for 6 hours. The MCL cells that passed through the Transwell inserts were measured and plotted. (J) MCL cells were added in Transwell inserts and incubated in plates with preseeded (overnight) monolayers of stromal cells (HS-5) or with only the supernatants harvested from cultured stromal cells (overnight). The MCL cells that passed through the Transwell insert were measured and plotted. Error bars were generated from 3 independent replicates (G–J). Two-way ANOVA was used in D and G–J, and statistical significance was determined based on the adjusted P values using Šídák’s method. Data represent mean ± SD. *P < 0.05; **P < 0.01; ***P < 0.001; ****P < 0.0001.

