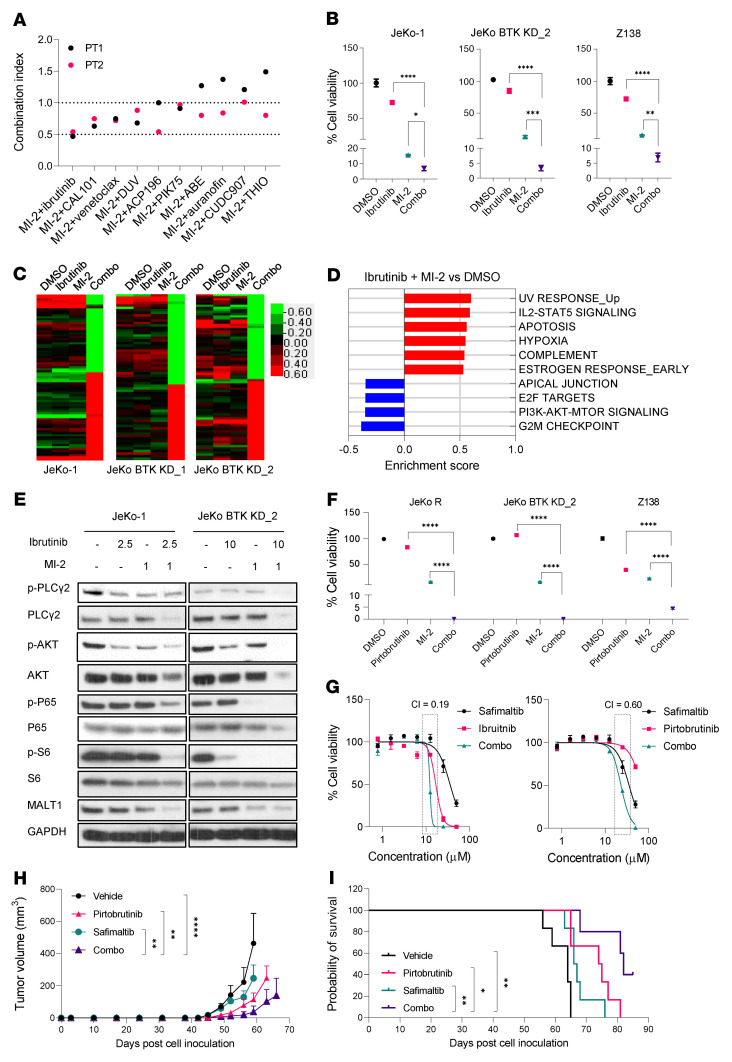
Figure 7. Dual targeting of BTK and MALT1 promotes potent anti-MCL activity in MCL cells with resistance to BTK inhibitors.
(A) Combinational screen for MI-2 using 2 ibrutinib-resistant primary patient (PT) samples. The combination index was calculated and plotted for each combination. (B) MI-2 plus ibrutinib combination (combo) is synergistic against JeKo-1, JeKo BTK KD-2, and Z138 cells. (C) RPPA analysis for JeKo-1 and JeKo BTK KD-1 and -2 cells treated with MI-2 and ibrutinib, alone or in combination, for 6 hours. (D) GSEA revealed the top cancer hallmarks altered by the combination of MI-2 plus ibrutinib compared with DMSO control. Blue bars indicate the pathways downregulated by the ibrutinib plus MI-2 combination and red bars indicate the pathways upregulated by the combination. (E) Western blot analysis for JeKo-1 and JeKo BTK KD-2 cells treated with MI-2 and ibrutinib, alone or in combination, for 6 hours. (F) The combination effect of MI-2 plus pirtobrutinib combination ibrutinib-resistant JeKo-R, JeKo BTK KD-2, and Z138 cells. (G) The combination effect of safimaltib in combination with ibrutinib (left panel) or pirtobrutinib (right panel) in ibrutinib-resistant JeKo-R cells. The combination index is labeled for the indicated doses highlighted with the dotted rectangular boxes. Error bars were generated from 3 independent replicates (B, F, and G). (H and I) Freshly isolated primary PDX cells were injected subcutaneously into NSG mice to establish PDX models (n = 6 per group). When the subcutaneous tumors became palpable, the mice were treated with vehicle, pirtobrutinib (30 mg/kg twice daily), or safimaltib (50 mg/kg daily), alone or in combination. Tumor growth (H) and mouse survival (I) were monitored and plotted. Data represent mean ± SD. One-way ANOVA was used in B and F, 2-way ANOVA was used in H, and the pairwise log-rank test was used in I. Statistical significance was determined based on the adjusted P values using Šídák’s method. *P < 0.05; **P < 0.01; ***P < 0.001; ****P < 0.0001.

