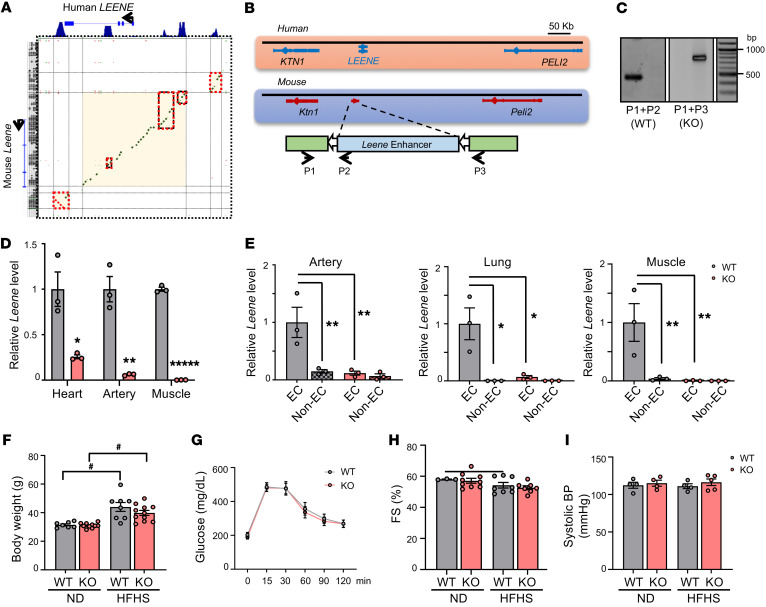
Figure 3. Generation of a Leene-KO mouse model.
(A) DNA sequence alignment between the human LEENE and the syntenic region in mouse. Green indicates conservation on the sense strand and red indicates conservation on the antisense strand. Red boxes mark the sequence alignment in the H3K27ac-enriched peak regions shown on the top. (B) Human LEENE and mouse Leene loci; CRISPR/Cas9 targeting strategy in mouse genome and genotyping primers to identify WT (P1 + P2) and KO (P1 + P3). (C) Genotyping by PCR with P1–P3 primers as depicted in B. (D) qPCR of Leene in different organs/tissue of WT and KO littermates (n = 3/group). (E) qPCR of Leene in EC and non–EC-enriched fractions isolated from different tissues of WT and KO littermates (n = 3 mice/group). (F–I) Male Leene-KO and WT littermates were fed chow or HFHS diet for 16 weeks starting at 8 weeks old. (F) Body weight, (G) glucose tolerance, (H) fractional shortening (FS), and (I) systolic BP were measured (n = 3–11/group). Data are represented as mean ± SEM. #P = 0.05; *P < 0.05; **P < 0.01; *****P < 0.00001 between indicated groups by 2-tailed Student’s t test (D) or 2-way ANOVA followed by Tukey’s test (E and F).

