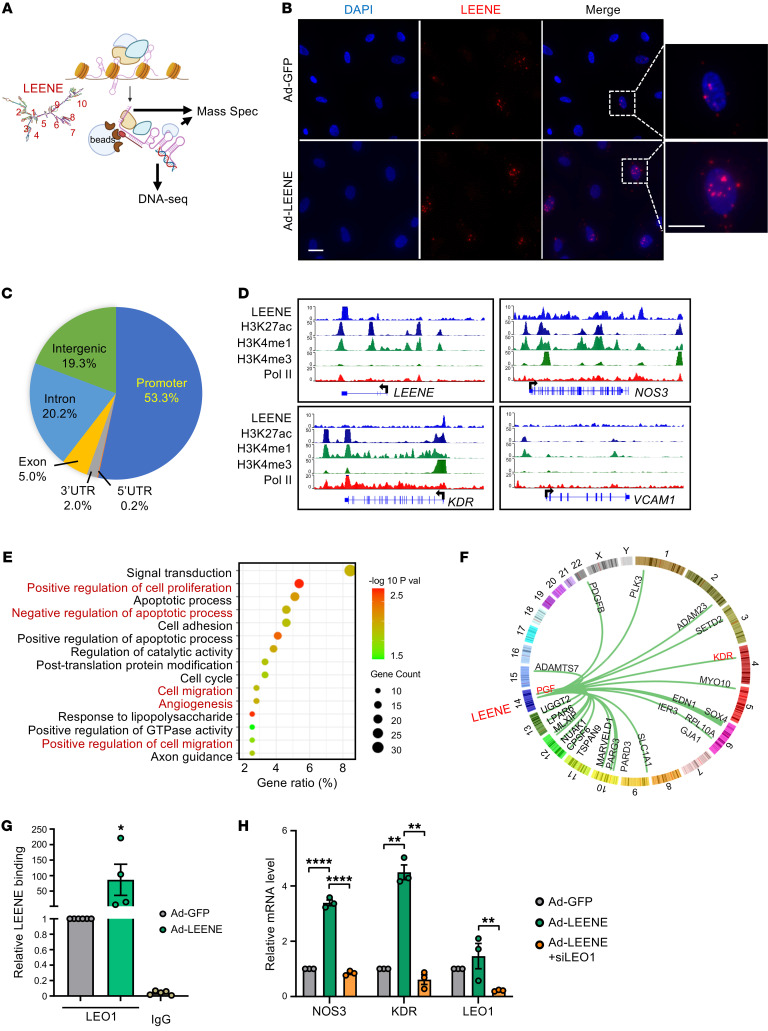
Figure 8. LEENE interacts with promoters and LEO1 to increase proangiogenic gene expression.
(A) Schematic diagram showing ChIRP performed with 10 biotinylated probes, the locations of which are shown based on the predicted secondary structure of LEENE. The ChIRP precipitates were subjected to DNA-seq and mass spectrometry. (B) smRNA FISH of LEENE in ECs infected with Ad-GFP or Ad-LEENE. Scale bar: 50 μm. (C and D) ChIRP-seq was performed with Ad-LEENE–infected HUVECs in biological triplicates. (C) Pie chart showing the proportion of reads aligned to different genomic regions. (D) LEENE binding signals in representative genes (top blue tracks) in parallel to HUVEC ChIP-seq data from ENCODE. (E) GO analysis of top 15 enriched pathways in LEENE interactome and regulome, i.e., 395 genes downregulated by LEENE KD in vitro and showing genomic interaction with LEENE. (F) Circle plot showing LEENE interaction with 23 LEENE-regulated (in vitro and in vivo) and -interacting genes. (G) RIP performed with HMVECs and anti-LEO1 antibody with IgG as an isotype control. LEENE RNA in the immunoprecipitates was quantified by qPCR and the relative enrichment in the Ad-GFP sample was set to 1. *P = 0.04 based on 1-way ANOVA followed by Dunnett’s test. (H) qPCR analysis of NOS3, KDR, and LEO1 in HMVECs transfected by scramble or LEO1 siRNA (siLEO1) and infected by Ad-GFP or Ad-LEENE. Bar graphs represent mean ± SEM. **P < 0.01; ****P < 0.0001 compared with Ad-GFP or between indicated groups based on 1-way ANOVA followed by Dunnett’s test.

