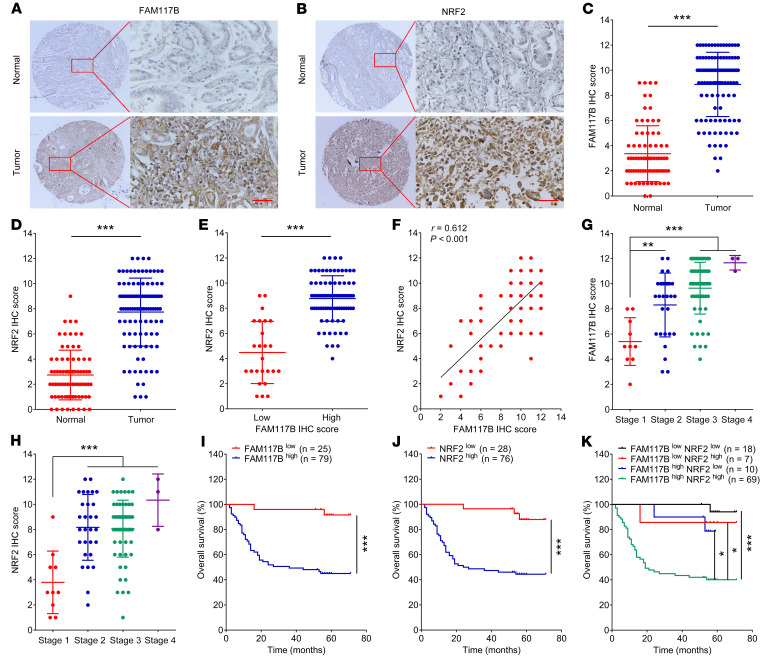
Figure 9. FAM117B and NRF2 are both overexpressed in gastric cancer tissues, and their co-overexpression represents a factor for poor prognosis.
(A–D) FAM117B and NRF2 IHC scores of tumor tissues (n = 104) and adjacent normal tissues (n = 76) in SOB cohort. Scale bars: 50 μm. (E) IHC scores of NRF2 in tumor tissues with low (n = 25) or high (n = 79) FAM117B IHC score. (F) Spearman correlation analysis of FAM117B and NRF2 IHC scores in tumor tissues (n = 104). (G and H) IHC scores of FAM117B and NRF2 in tumor tissues with clinical stage 1 (n = 10), stage 2 (n = 29), stage 3 (n = 61), and stage 4 (n = 3). One patient’s clinical stage information was missing. (I–K) Kaplan-Meier survival analysis. Data are shown as mean ± SD. *P < 0.05, **P < 0.01, and ***P < 0.001 indicate significant difference. Statistical significance was calculated using 2-tailed unpaired Student’s t test (2 groups), 1-way ANOVA followed by Tukey’s test (more than 2 groups), 2-tailed Spearman test, or log-rank test.

