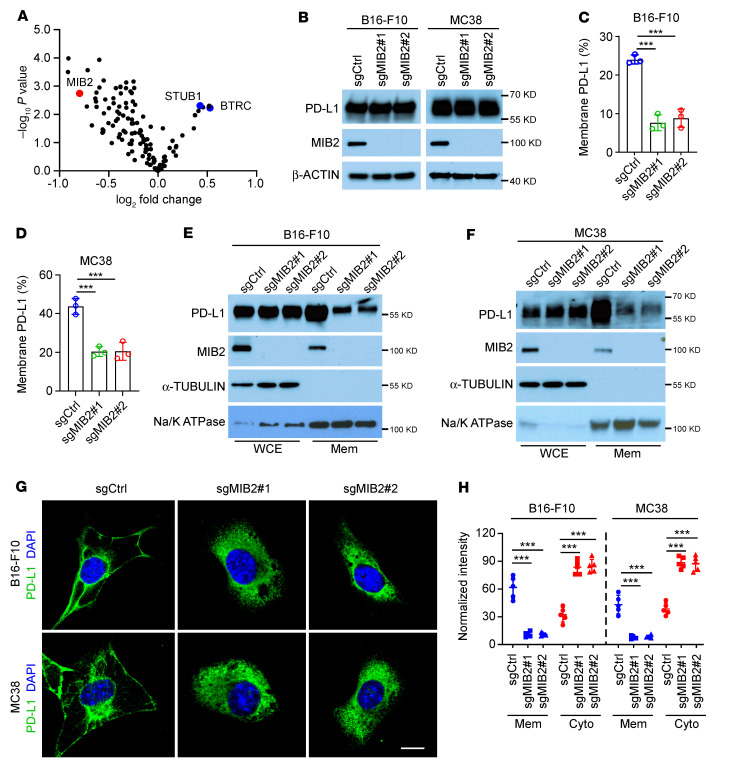
Figure 1. MIB2 regulates membrane PD-L1 levels in tumor cells.
(A) Volcano plot showing the E3 ligases identified from FACS. MIB2 is indicated in red, and STUB1 and BTRC are indicated in blue. (B) Immunoblotting (IB) analysis of PD-L1 levels in MIB2-KO B16-F10 and MC38 cells. (C and D) FACS analysis of membrane PD-L1 levels in (C) B16-F10 and (D) MC38 cells. (E and F) IB analysis of PD-L1 protein levels in whole-cell extract (WCE) and membrane fractions (Mem) from (E) B16-F10 and (F) MC38 cells. (G and H) Immunofluorescence analysis of PD-L1 in B16-F10 and MC38 cells. (G) Representative images of green fluorescence–labeled PD-L1. Scale bar: 10 μm. (H) Quantitative analysis of membrane- and cytoplasmic-expressed PD-L1 (n = 5). Cyto, cytoplasm. ***P < 0.001 by 1-way ANOVA test with Dunnett’s multiple comparisons test (C, D, and H).

