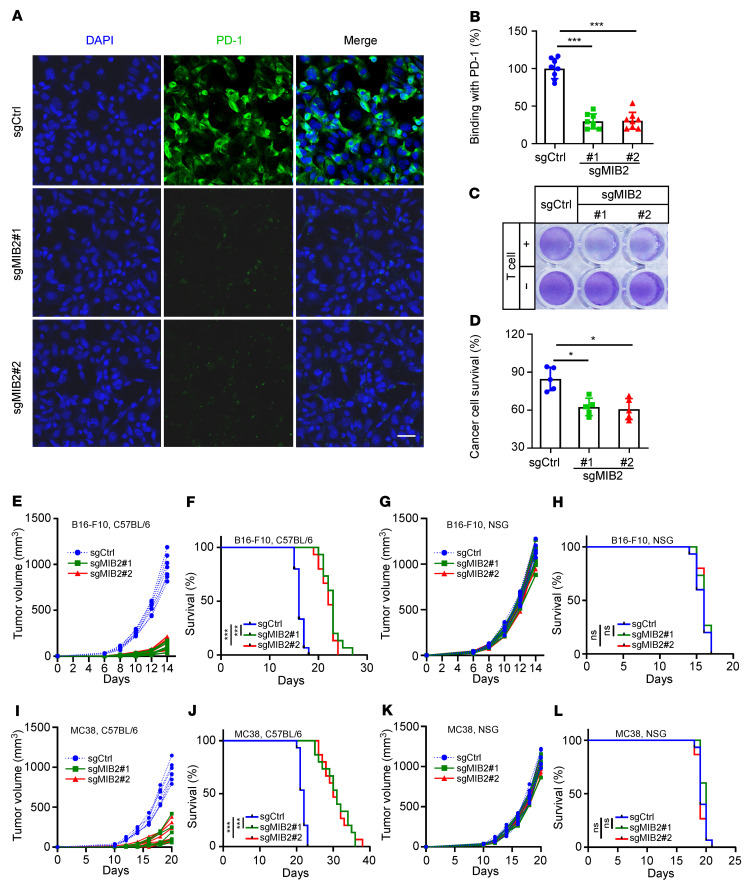
Figure 2. Depletion of MIB2 enhances antitumor immunity.
(A and B) Immunofluorescence analysis of PD-1 at the A375 cell surface. (A) Representative images of binding of green fluorescence–labeled exogenous PD-1-Fc. Scale bar: 25 μm. (B) Quantitation (n = 7). (C and D) A375 cell survival upon incubation with allogeneic T cells. A375 cells were cocultured with or without activated T cells at a ratio of 1:5 for 48 hours and subjected to crystal violet staining. (C) Representative images. (D) Quantitation. (E) Growth curve of B16-F10 tumors in C57BL/6 mice (n = 7 per group). (F) Kaplan-Meier survival curves of B16-F10 tumor-bearing C57BL/6 mice (n = 15 per group). (G) Growth curve of B16-F10 tumors in NSG mice (n = 7 per group). (H) Kaplan-Meier survival curves of B16-F10 tumor-bearing NSG mice (n = 15 per group). (I) Growth curve of MC38 tumors in C57BL/6 mice (n = 7 per group). (J) Kaplan-Meier survival curves of MC38 tumor-bearing C57BL/6 mice (n = 15 per group). (K) Growth curve of MC38 tumors in NSG mice (n = 7 per group). (L) Kaplan-Meier survival curves of MC38 tumor-bearing NSG mice (n = 15 per group). *P < 0.05; ***P < 0.001; by log-rank (Mantel-Cox) test (F, H, J, and L) and by 1-way ANOVA test with Dunnett’s multiple comparisons test (B and D). Data are shown as the mean ± SEM.

