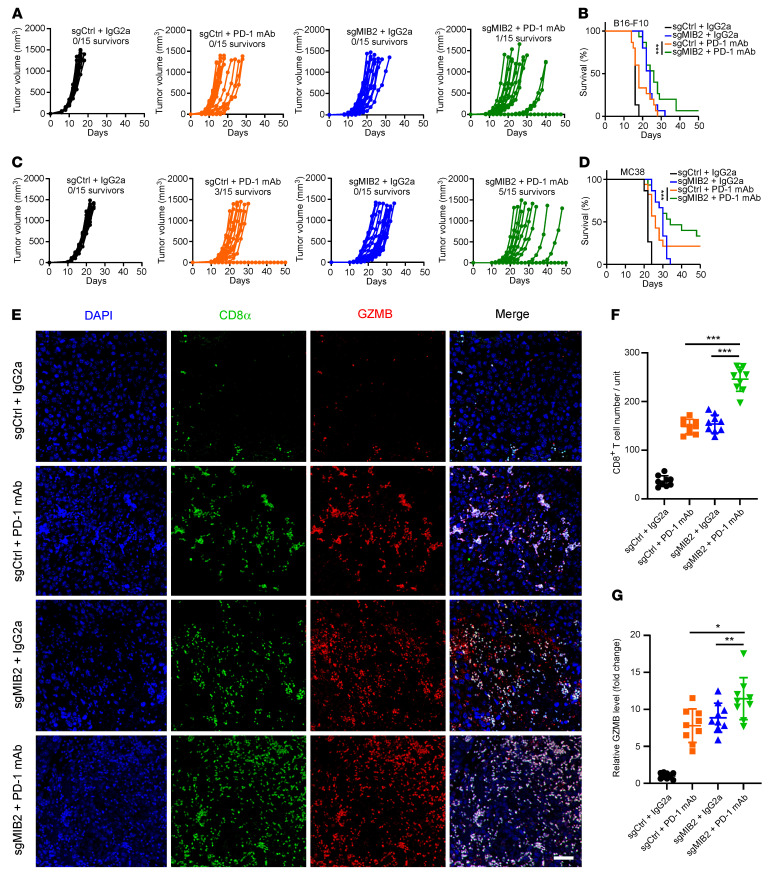
Figure 3. Depletion of MIB2 improves the efficacy of anti–PD-1 immunotherapy.
(A) Volumes of B16-F10 syngeneic tumors treated with control antibody (IgG2a) or PD-1 mAb. (B) Kaplan-Meier survival curves for each treated group from A (n = 15 per group). (C) Volumes of MC38 syngeneic tumors treated with control antibody (IgG2a) or PD-1 mAb. (D) Kaplan-Meier survival curves for each treated group from C (n = 15 per group). (E–G) Immunostaining of CD8 and granzyme B (GZMB) in the B16-F10 tumors treated with control (IgG2a) or PD-1 mAb. Data are shown as the mean ± SD (n = 9); 3 tissue slides per tumor. (E) Representative images. Scale bar: 50 μm. (F) Quantification of CD8+ T cells. (G) Relative GZMB level. Unit = 262,144 μm2 (the area of the tumor tissue). *P < 0.05; **P < 0.01; ***P < 0.001 by log-rank (Mantel-Cox) test (B and D) and by 1-way ANOVA test with Dunnett’s multiple comparisons test (F and G). Data are shown as the mean ± SEM.

