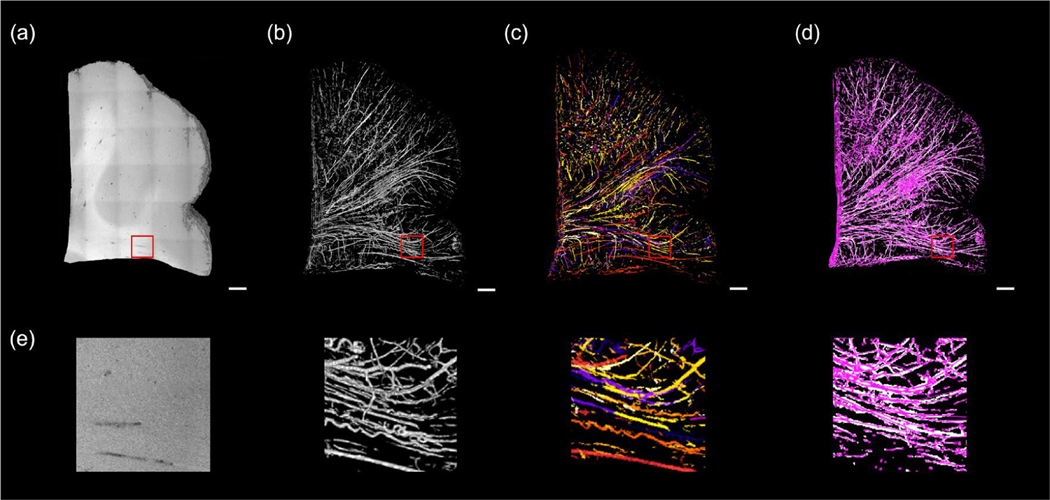
Figure 4:
Frangi filtering and graph reconstruction of volumetric OCT. Scale bars: 1 mm. (a) 3D rendering of the OCT volume. (b) 3D rendering of the Frangi segments. (c) Skeletonization and tracing each segment from the Frangi segments. End-point voxels are displayed in blue, slab voxels in orange and junction voxels in purple. (d) The final graph representation of the vessel network of the OCT volume after pruning. (e) The zoom-in view of the red rectangles in (a) – (d).

