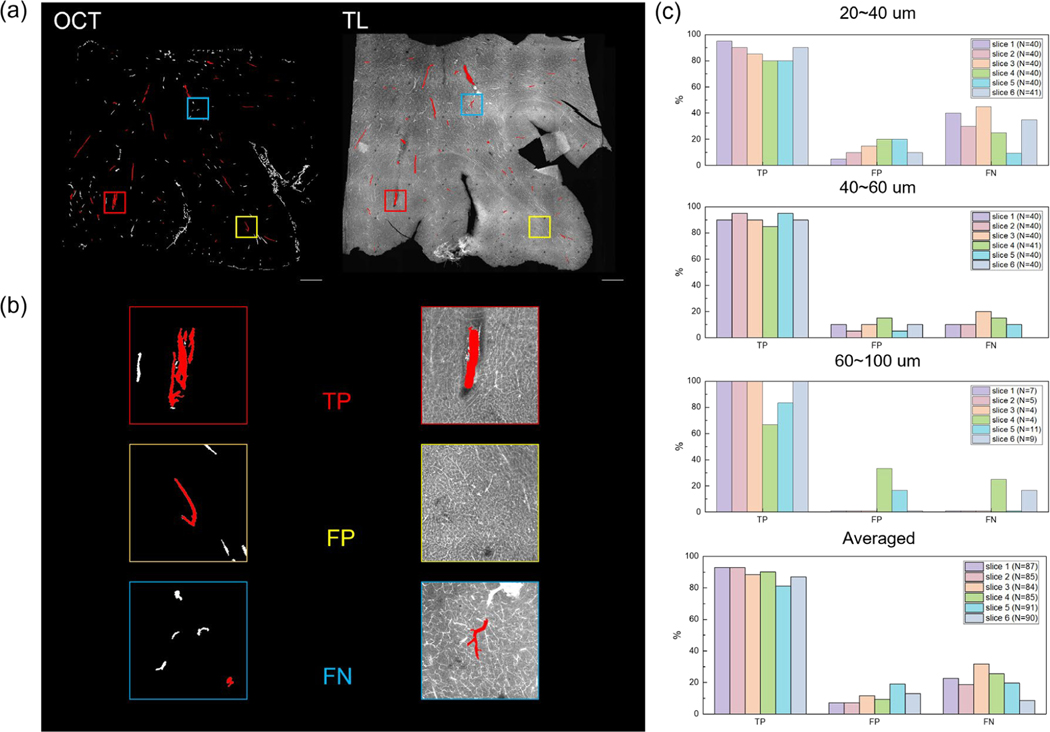
Figure 6:
Validation of OCT imaging vasculature by comparing with tomato lectin staining. (a) An example of slice-by-slice comparison between the vessel segments from volumetric OCT and the tomato lection stained image. The vessels selected by the independent observer were labeled in red. (b) An example of a true positive (TP), a false positive (FP) and a false negative (FN) case in the example slice in (a). (c) Bar plot of the true positive (TP), false positive (FP) and false negative (FN) rate for the selected vessels of different diameters in each slice, as well as averaged across all slices. The total number of vessels selected was labeled in caption.

