
Figure 1.
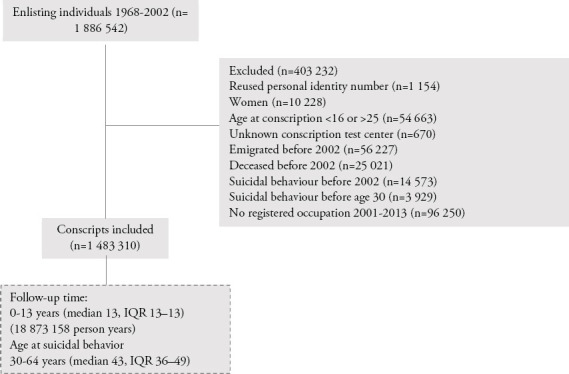
The figure shows the flow chart of included and excluded conscripts, median years of observation (follow-up time) and age at suicidal behavior with interquartile ranges (IQR) and total person years of observation.
Official websites use .gov
A
.gov website belongs to an official
government organization in the United States.
Secure .gov websites use HTTPS
A lock (
) or https:// means you've safely
connected to the .gov website. Share sensitive
information only on official, secure websites.
The figure shows the flow chart of included and excluded conscripts, median years of observation (follow-up time) and age at suicidal behavior with interquartile ranges (IQR) and total person years of observation.