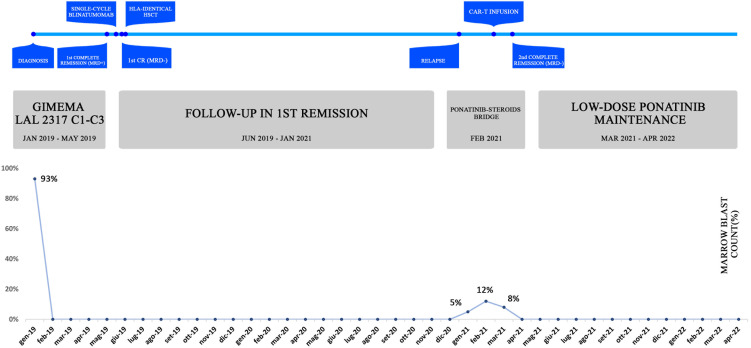
Figure 1.
Case report timeline. The table offers an overview of the patient’s history, treatment lines (A) and corresponding marrow blast count (B). The percentage of bone marrow blasts was evaluated at significant time-points, namely at diagnosis, post-induction, post-transplant, at disease relapse, during bridging and after CAR-T infusion. At the last follow-up, the patient is still in molecular remission and in persistent B-cell aplasia.

