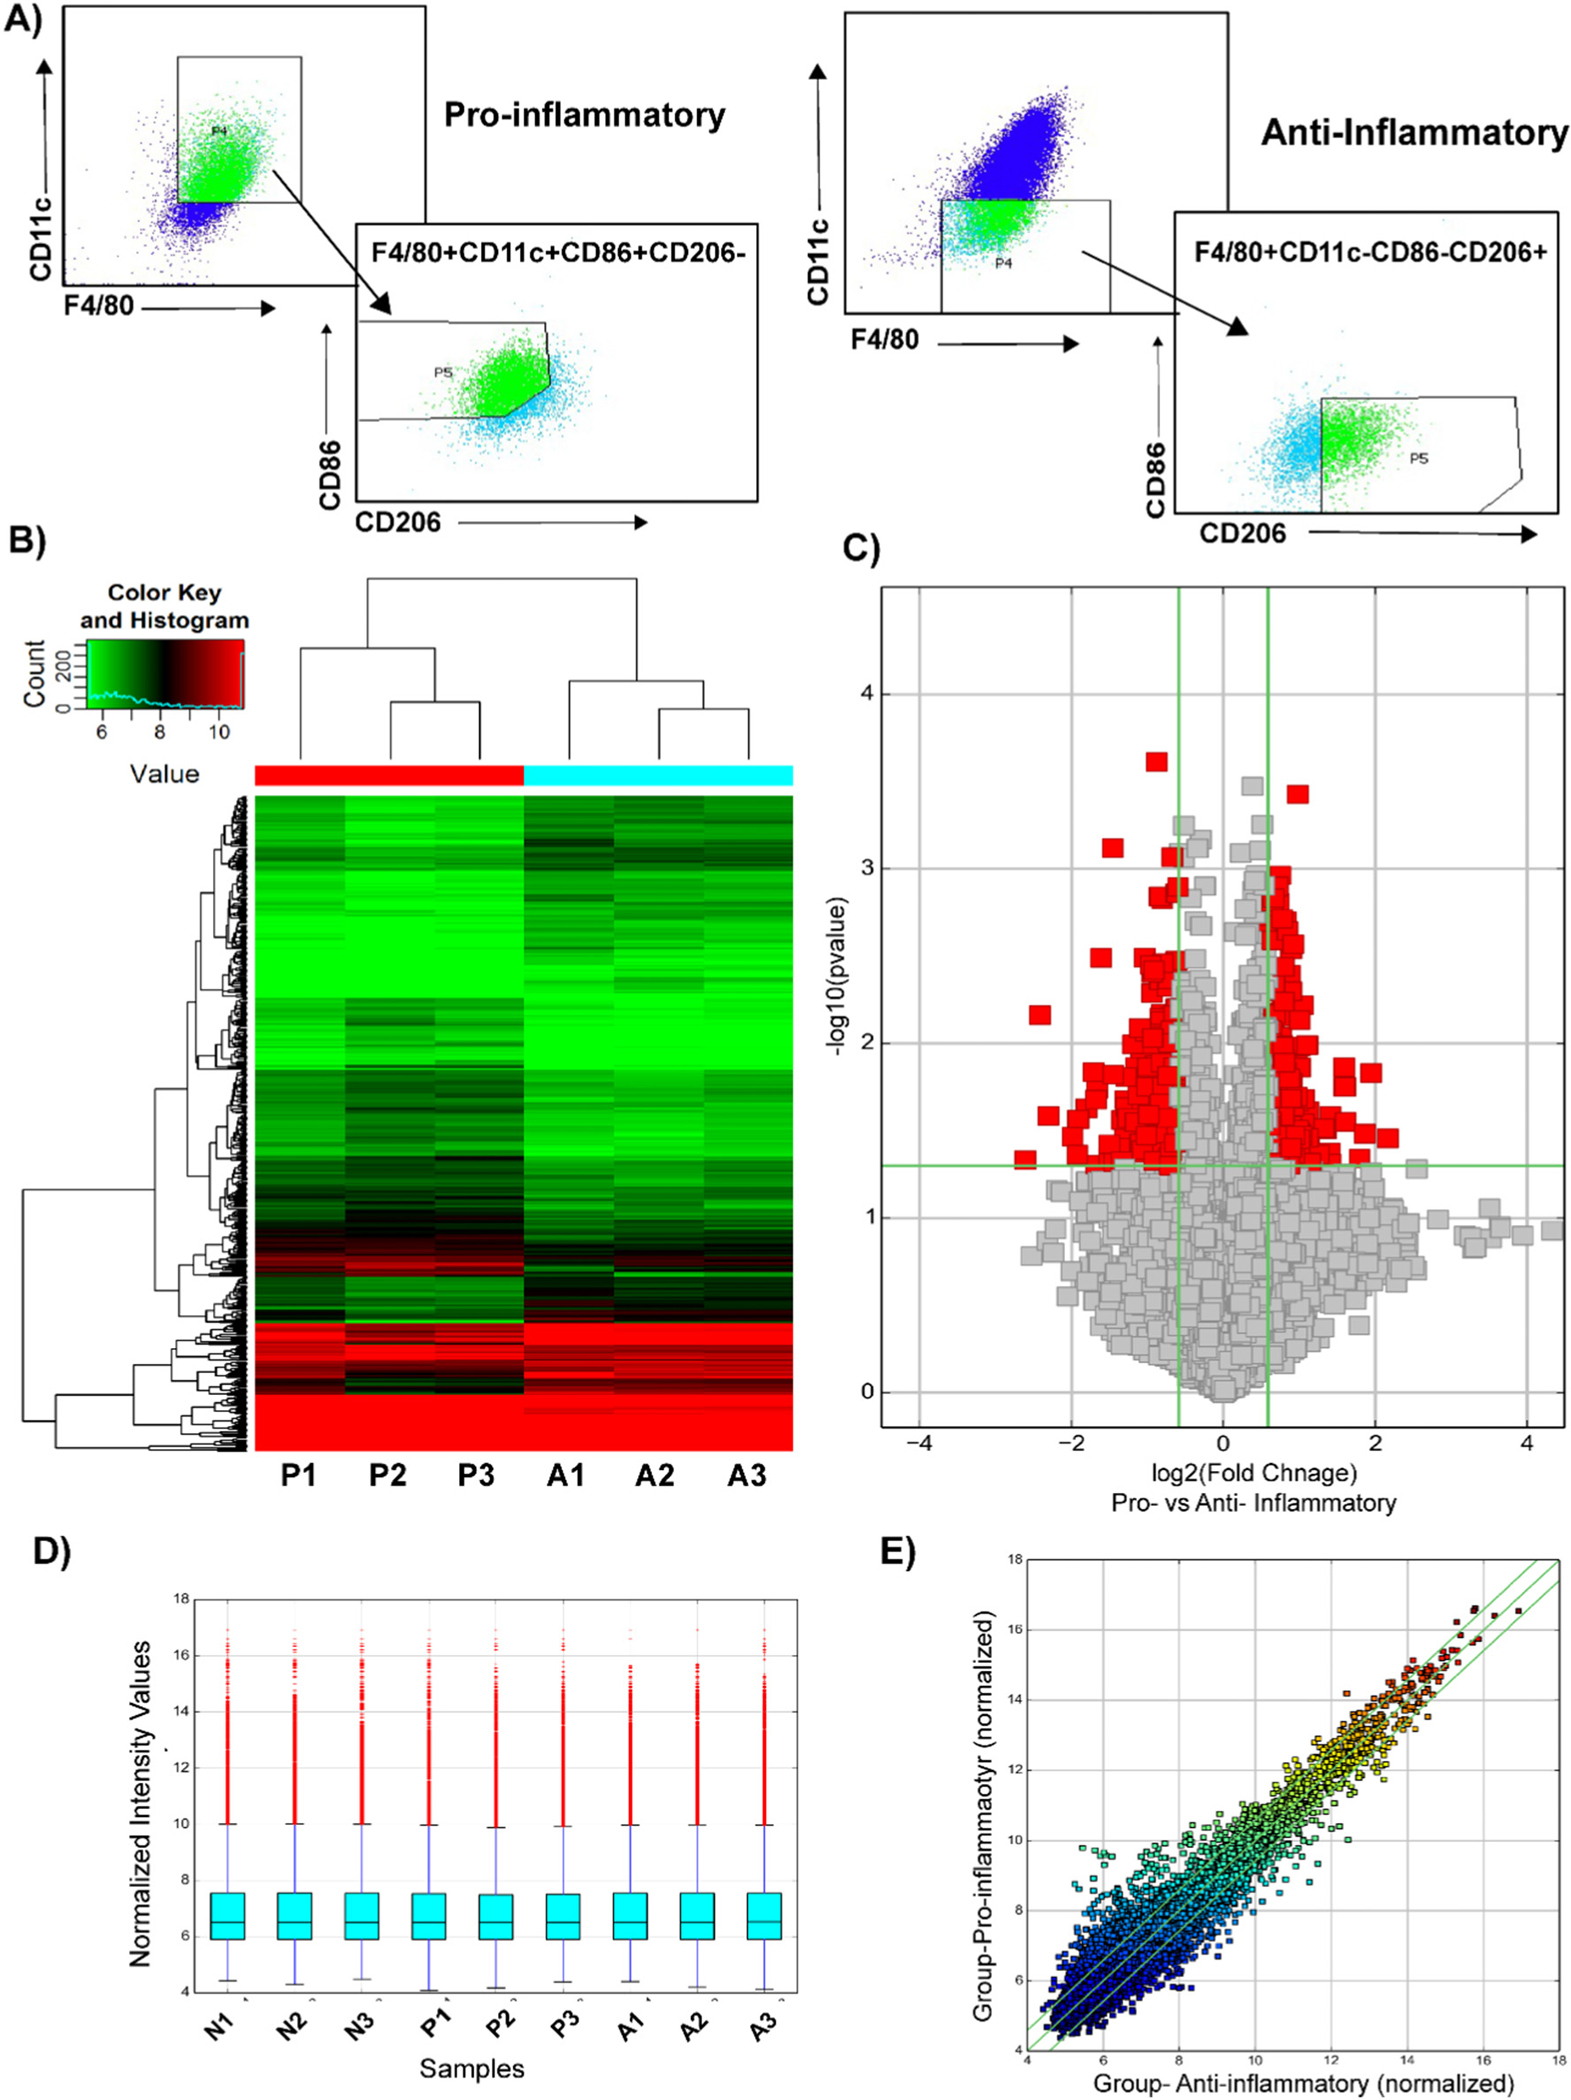
Fig. 1.

Microarray analysis of differentially expressed circular RNAs in bone marrow derived macrophages. (A) The BMDMs were sorted based on the following cell surface markers: pro-inflammatory- F4/80+, CD86+, CD11c+, CD206−; anti-inflammatory- F4/80+, CD86−, CD11c−, CD206+. Total RNA was isolated. (B) Heat map revealing differential circular RNA expression profiles between pro-inflammatory and anti-inflammatory macrophages. The red color indicates a higher FC value; green indicates a smaller FC value. (C) Volcano plot comparing significantly expressed circular RNA between pro-inflammatory and anti-inflammatory macrophages. The circular RNA expression log 2- transformed FC values (x-axis) were plotted against the log10 P values (on the y-axis). The red dots represent the circular RNAs having an FC value ≥1.5 and P < 0.05 comparing between pro-inflammatory and anti-inflammatory macrophages. (D) Box plot visualizing the distribution of a dataset for the circRNAs profiles. The distributions were nearly the same after normalization. (E) Scatter plot demonstrating the distributions of circular RNAs that are differentially expressed between pro-inflammatory and anti-inflammatory macrophages. The values of the x- and y-axes in the scatter plot were averaged to the normalized signal values of the group. FC, fold change; circRNA, circular RNA; N, naïve; P, pro-inflammatory; A-anti-inflammatory macrophages.
