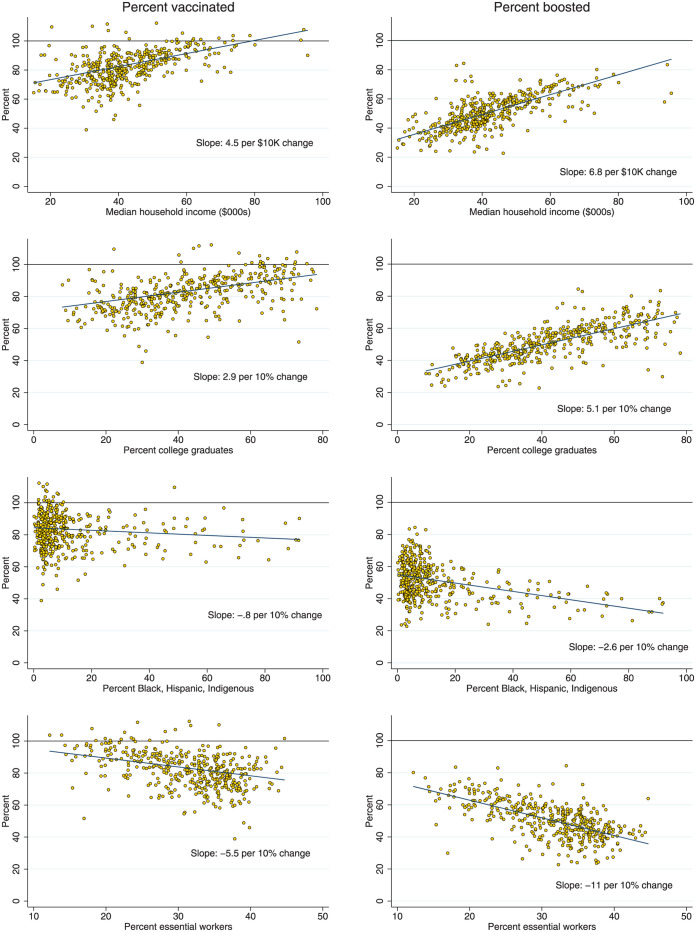
Fig 2. Percent vaccinated and boosted according to individual ZIP code characteristics.
Note: Data on vaccine and booster coverage are as of October 10, 2022. Fitted lines are from bivariate regressions. Coefficients and confidence intervals for bivariate and multivariable models are presented in Table 2. To preserve the scale across the plots, three outliers with estimated vaccine coverage over 115% were suppressed in the scatter plots but contribute to the fitted lines.

