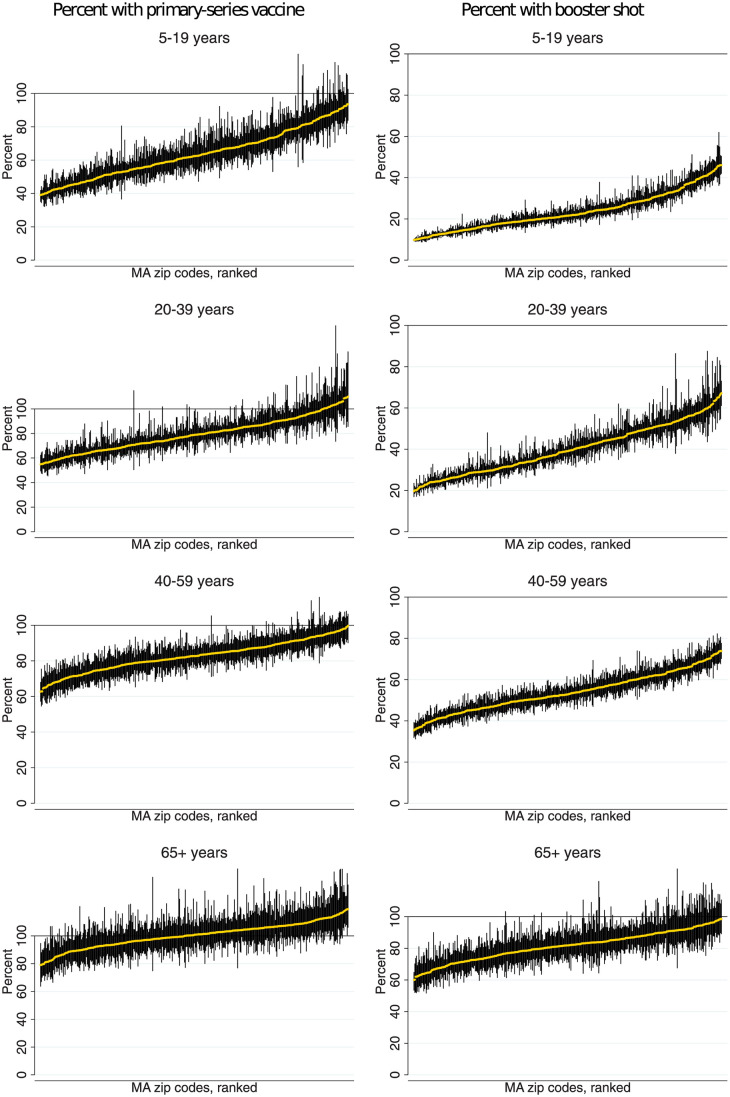
Fig 3. Percentage of residents who have received a COVID-19 vaccine by ZIP code and age.
Note: Data are ranked by percent vaccinated with the primary series or booster shot. Vertical lines are 90% confidence intervals, which capture uncertainty due to sampling error in the population denominators. Due to the presence of sampling error in the denominators, neither the point estimates nor confidence bounds are constrained to be within the [0%,100%] interval.

